| ID |
Date |
Author |
Status |
Type |
Category |
Location |
Title |
|
30
|
Fri Dec 6 11:53:53 2019 |
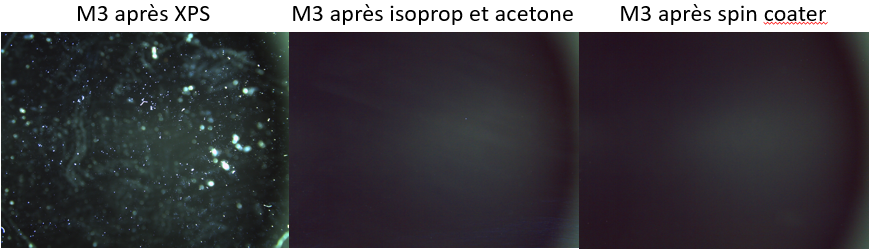
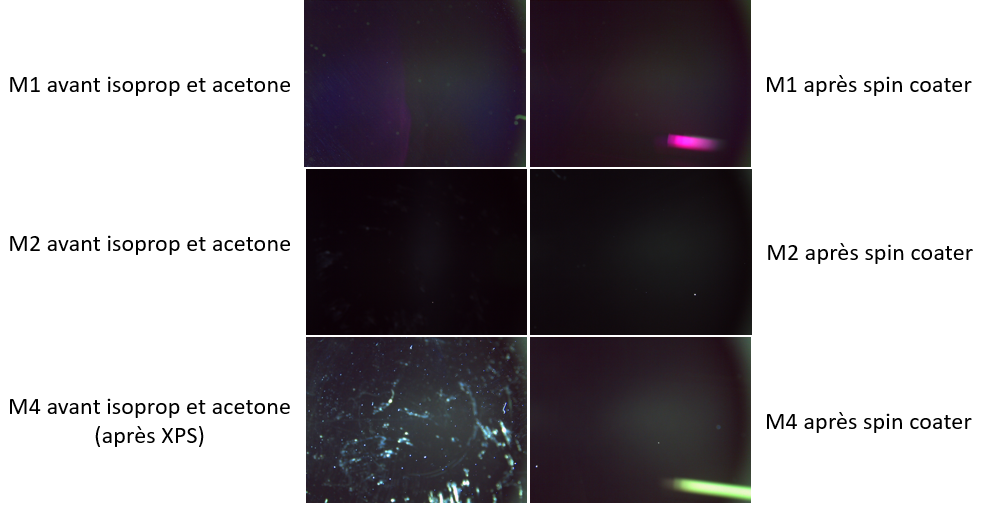
Loïc Amoudry | Fixed | report | lasers and optics | Optical room | Mirror's cleaning | XPS has been proceeded on the 400kW SBOX mirrors M3 and M4 (the initial cavity spherical mirrors) in frebruary 2019. Deposited a lot of particles on these mirrors.
All the mirrors received a Infrared spectroscopy the 12th of november 2019. Deposited glue on the non-reflective face (was used to hold them).
15th of november (2019): The four 400kW SBOX mirror's have been cleaned with aceton and isopropanol.
28th of november (2019): The four 400kW SBOX mirror's have been cleaned with spin coater.
Summary:
Aceton and isopropanol removed most of the particles and all the glue. But it let some traces on the mirror surface on all the mirrors (so there is some kind of grease on the surfaces).
Spin coater removes all the traces.
See pictures. On all the first images, we also see the dust which is on the non reflective face through the mirror. On M3 and M4 there is still the "glue" on the non reflective face on their frst images + refletive faces very dirty because of XPS. |
| Attachment 1: resume_M3.PNG
|  |
| Attachment 2: resume_M1_M2_M4.PNG
|  |
|
69
|
Tue Mar 29 16:23:00 2022 |
Manar Amer | Fixed | report | lasers and optics | cabling | Optical room | Mightylaser Amplifier | Migthylaser amplifier has been moved from the SBox table to the PLIC table.
|
|
46
|
Thu Jan 9 16:54:05 2020 |
Loïc Amoudry | Fixed | report | lasers and optics | Optical room | Microscope and cleaning of SBOX mirrors | The mirrors went in the cavity the 28th of november (We did several power up to 30kW stored and only one to 40kW then the power went down to 2kW during the run).
Microscope study shows that mirrors get some dust during the handling [travel from microscope to SBOX --> installation --> in SBOX for +1month and power up --> travel to microscope].
Almost all of these dusts can be removed with cleaning.
There is only one important difference between 28th of november and today, a large spot on M1. |
| Attachment 1: resume_nettoyage_apres_sejour_dans_K-BOX_et_montee_en_puissance.PNG
|  |
|
190
|
Wed Feb 21 17:33:59 2024 |
Xinyi Lu | Fixed | info | lasers and optics | Optical room | Menhir pulsed laser locking | These days, Ronic, Daniele and I achieved stable cavity locking with the menhir pulsed laser.
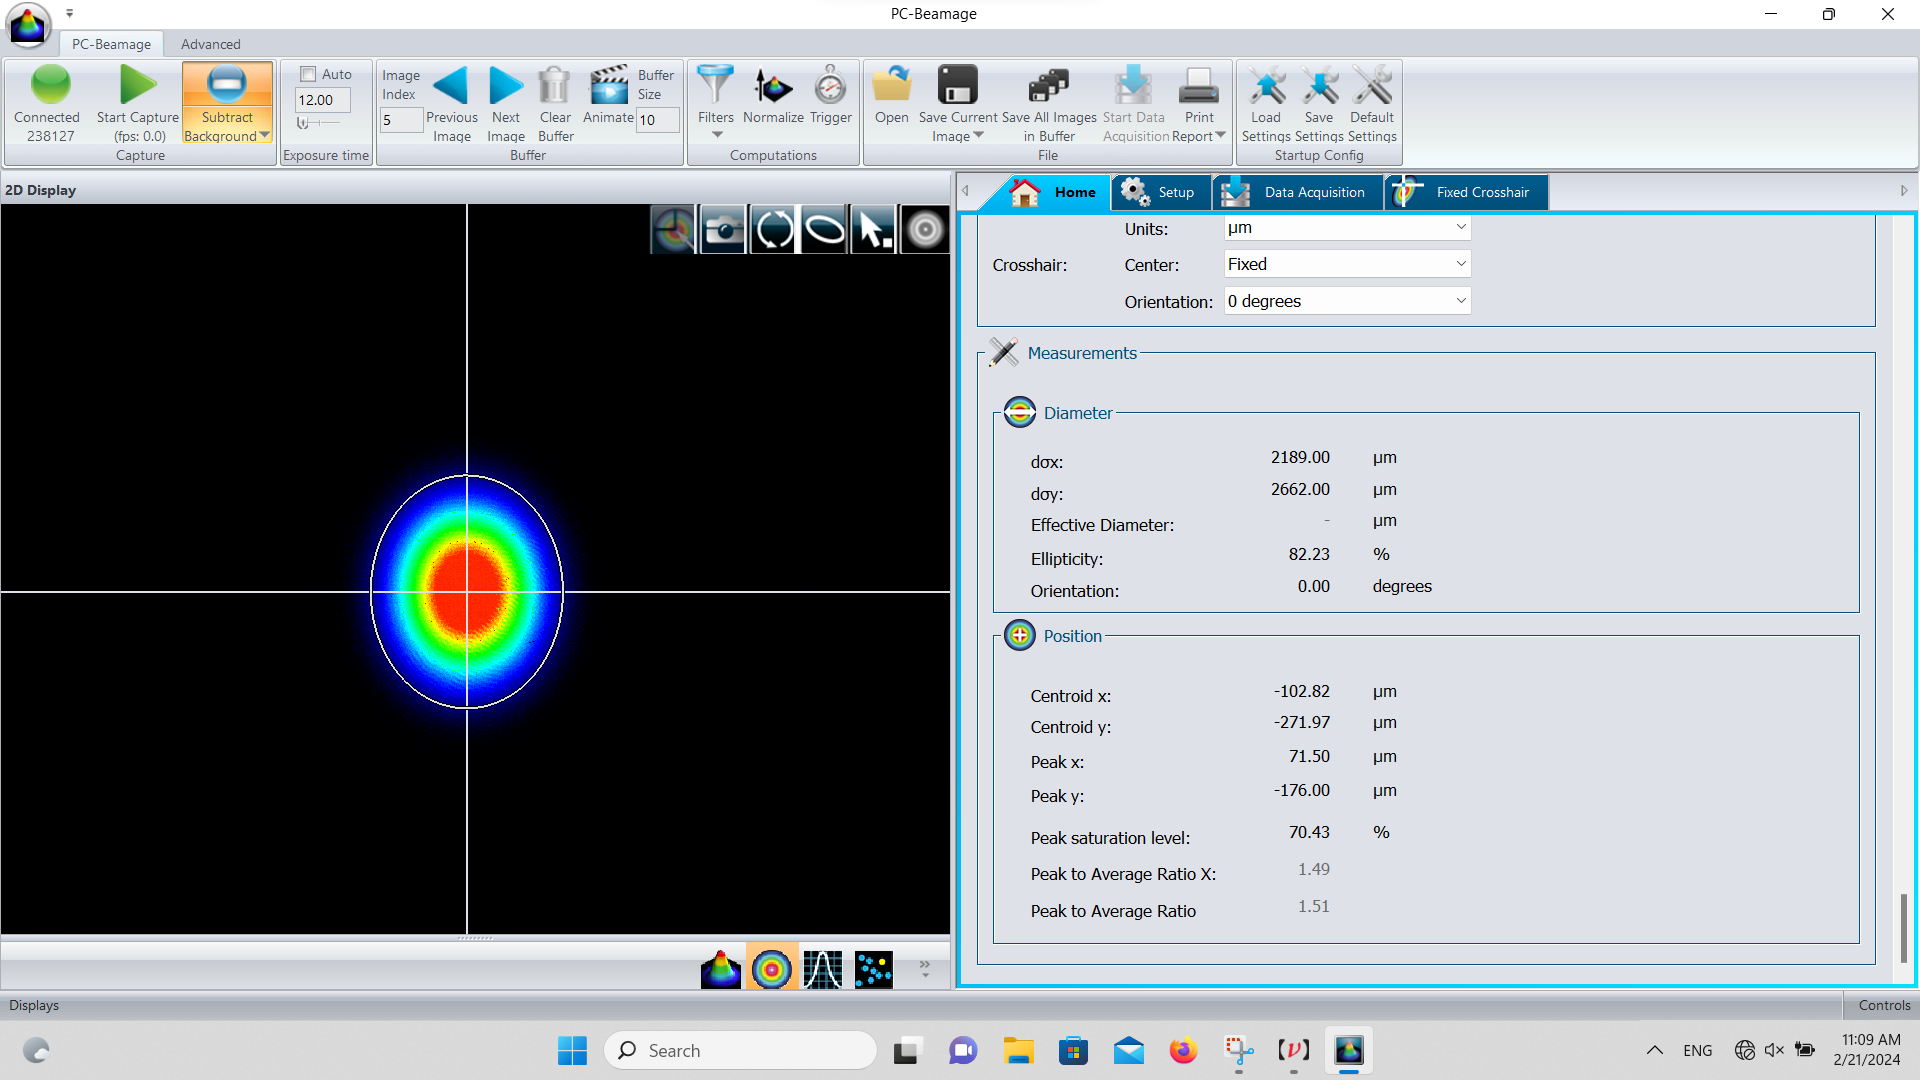
- After vacuuming, the current cavity finesse is now about 23,000. The diameter of the cavity mode is w_x=2.2mm, w_y=2.7mm.
- We had to compensate for frequency drift by manually adjusting the cavity length to keep locking.
Now the problem is that CEP's compensation range is not enough. The laser CEP is drifting from day to day. We adjusted the CEP by tuning the pump current of the menhir laser, but the adjustment range was not enough.
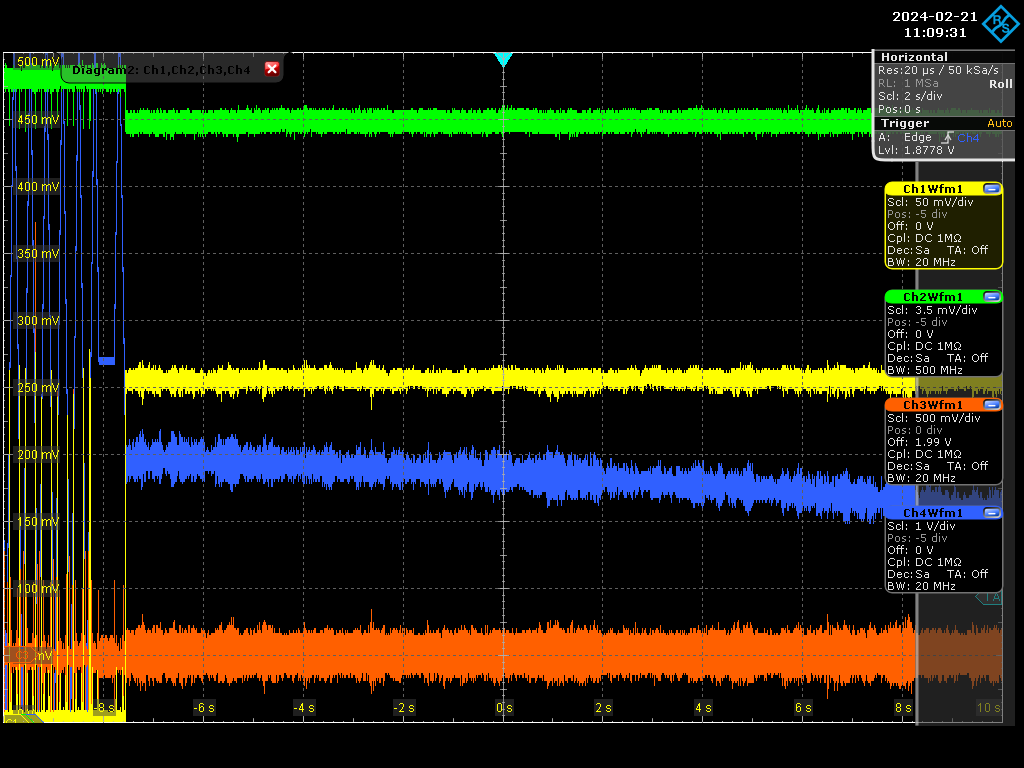
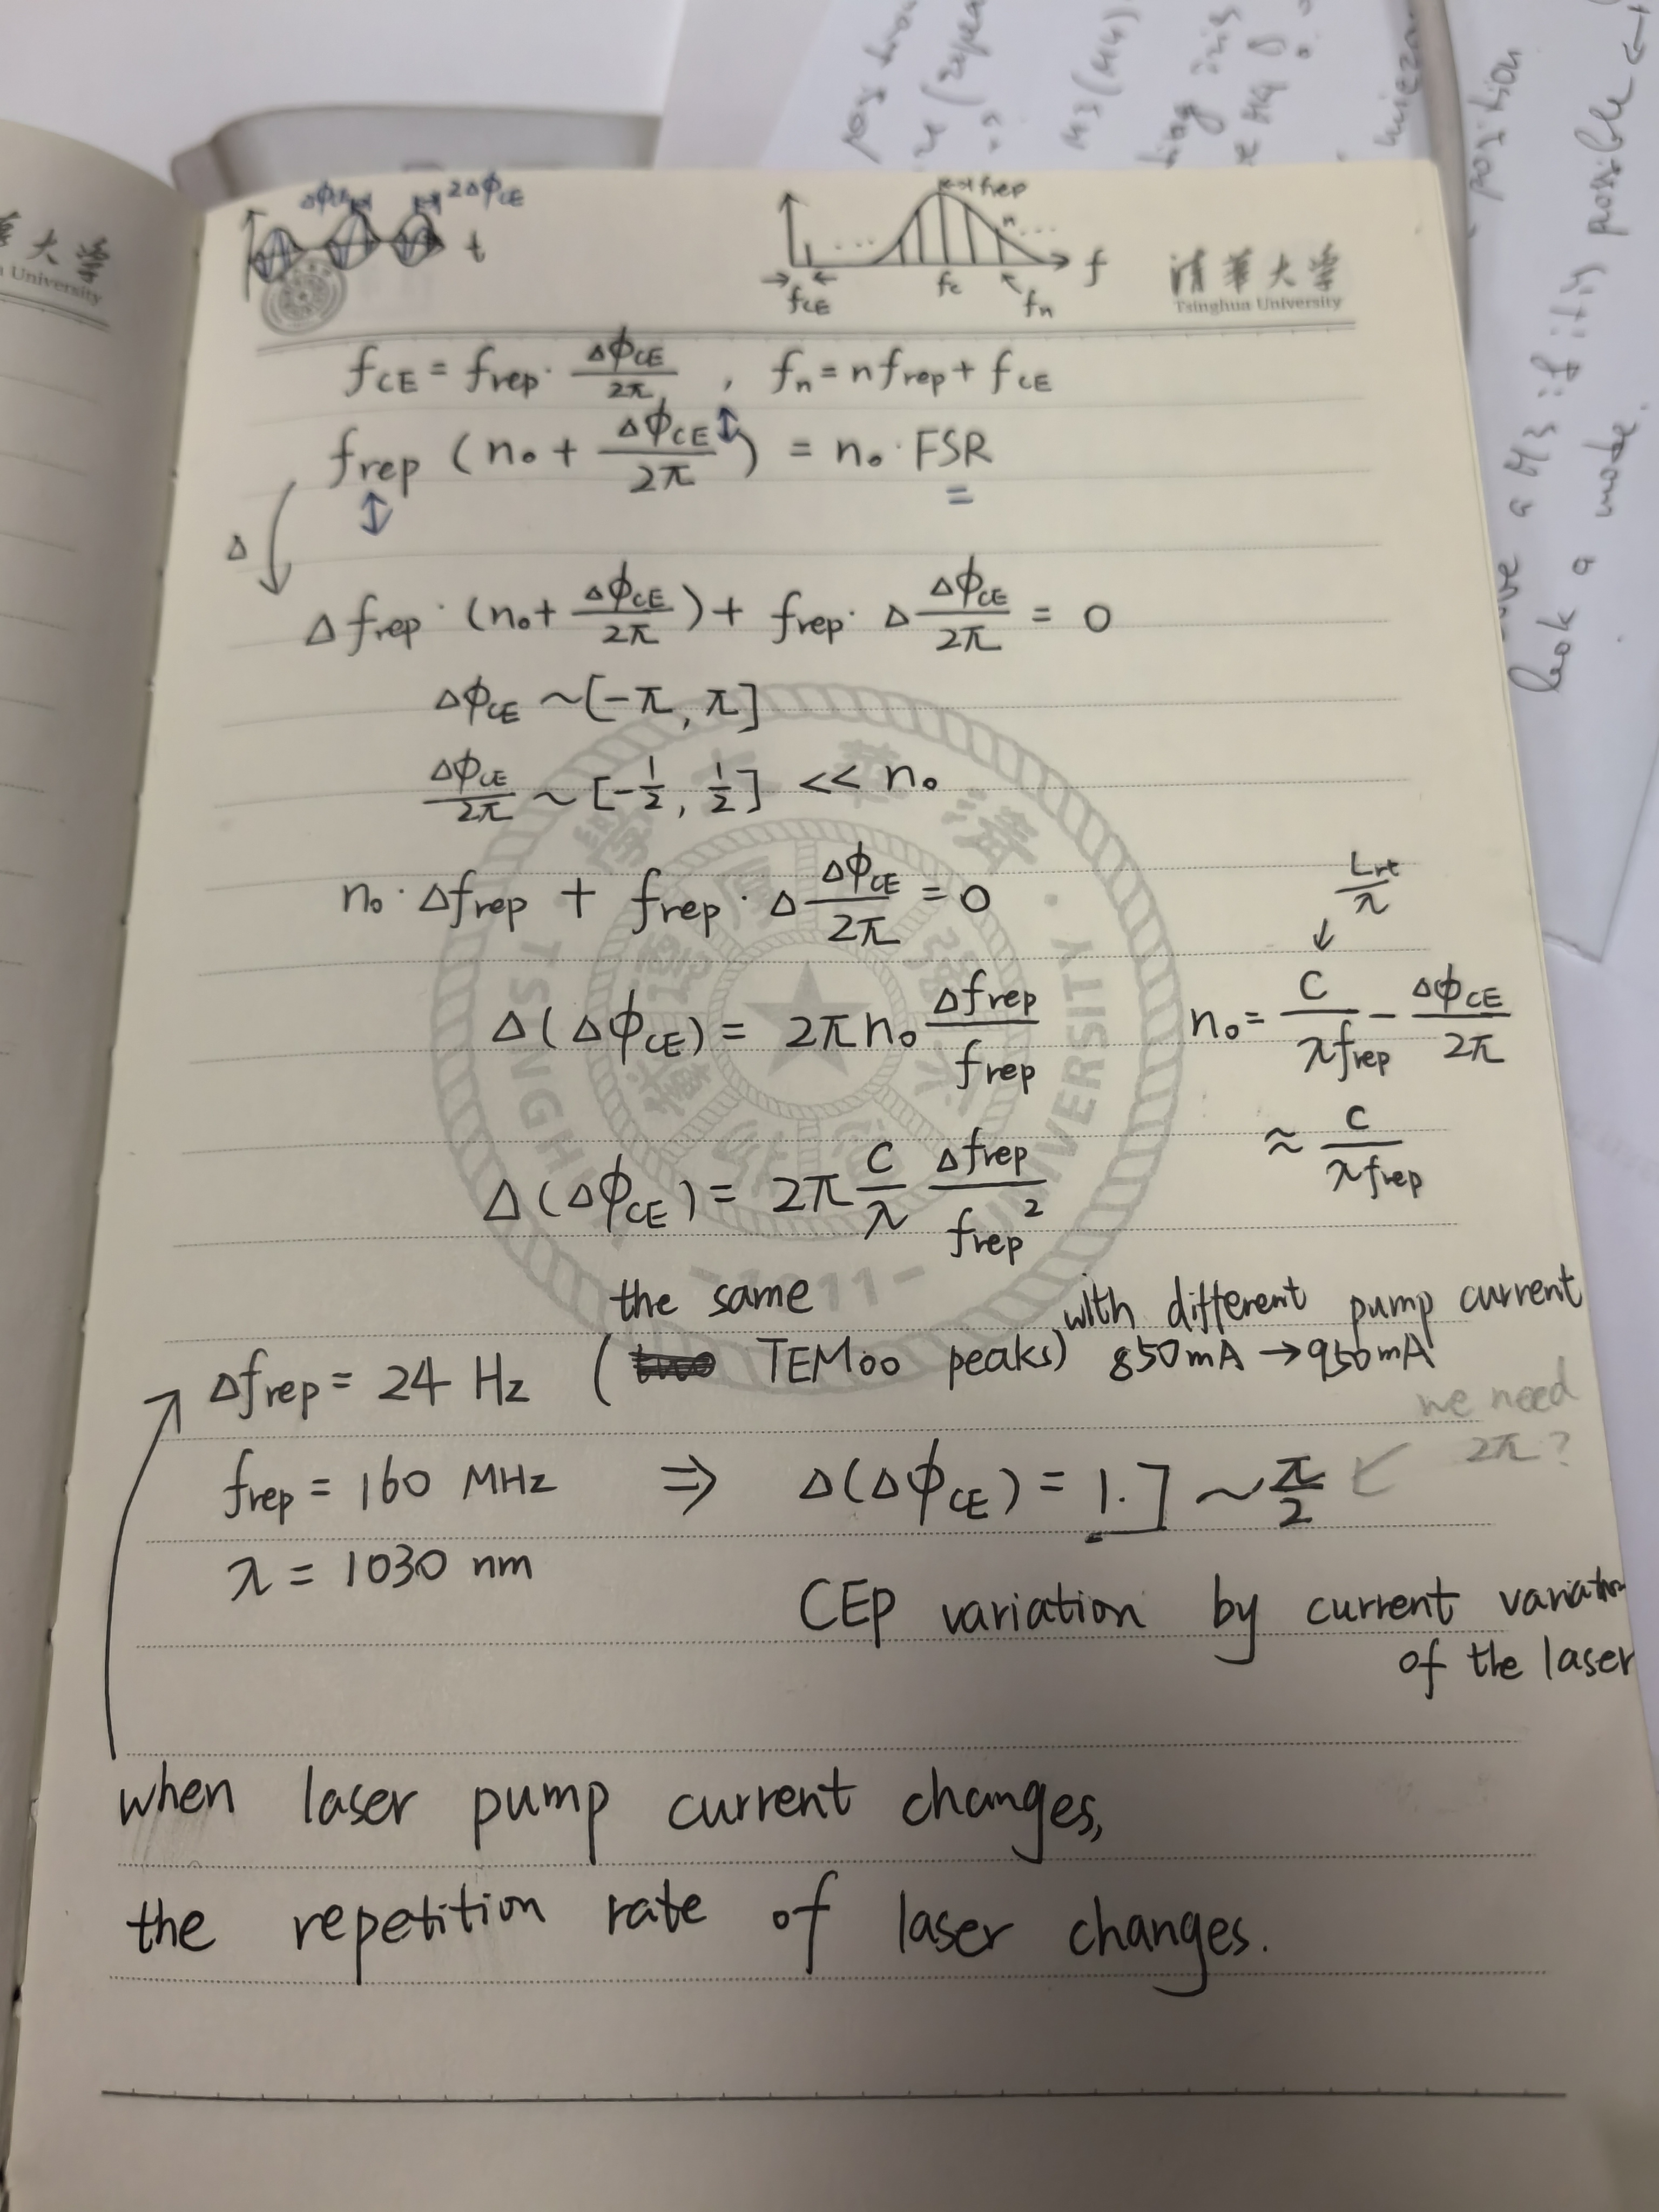
- The laser pump current is varied in the locking state and the variation of repetition rate is recorded. The current range is 850mA to 950mA and the repetition rate changes by 24 Hz. The calculation process is shown in Figure 3.
- By calculation, the variation of CEP caused by the variation of laser current is only π/2, which we hope is 2π.
- For Gamma Factory, the target FSR is 40 MHz, so the 4-pulse stack provides 4 times CEP tuning range to meet the requirements. But for our experiment, it seems not enough now.
The next step is to evaluate the gap to the maximum gain and draw the curve of CEP. Then we will discuss solutions.
|
| Attachment 1: Screenshot_2024-02-21_1_110931.png
|  |
| Attachment 2: Screenshot_2024-02-21_110934.png
|  |
| Attachment 3: calculation.jpg
|  |
|
191
|
Wed Feb 21 18:09:11 2024 |
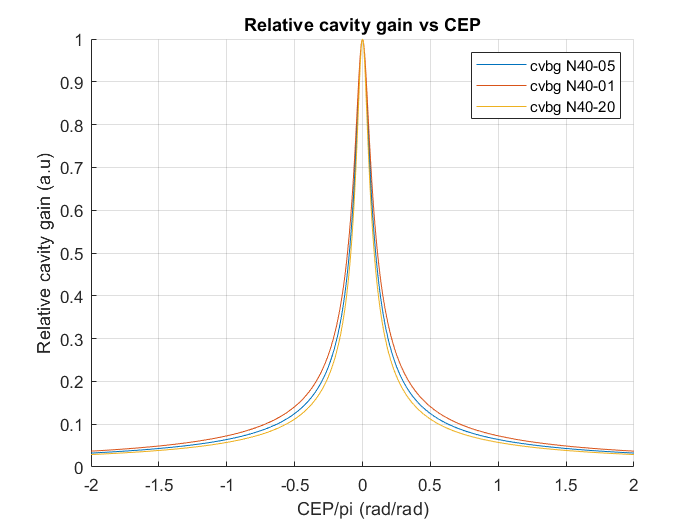
Xinyi Lu | Fixed | info | lasers and optics | Optical room | Menhir pulsed laser locking | Here is a simulation of the relative FP-cavity gain vs the CEP for a Finesse of 23000 and taking into account the Menhir laser optical spectrum and several CVBG parameters.
I added the commented Matlab code to produce this plot.
| Xinyi Lu wrote: |
|
These days, Ronic, Daniele and I achieved stable cavity locking with the menhir pulsed laser.
- After vacuuming, the current cavity finesse is now about 23,000. The diameter of the cavity mode is w_x=2.2mm, w_y=2.7mm.
- We had to compensate for frequency drift by manually adjusting the cavity length to keep locking.
Now the problem is that CEP's compensation range is not enough. The laser CEP is drifting from day to day. We adjusted the CEP by tuning the pump current of the menhir laser, but the adjustment range was not enough.
- The laser pump current is varied in the locking state and the variation of repetition rate is recorded. The current range is 850mA to 950mA and the repetition rate changes by 24 Hz. The calculation process is shown in Figure 3.
- By calculation, the variation of CEP caused by the variation of laser current is only π/2, which we hope is 2π.
- For Gamma Factory, the target FSR is 40 MHz, so the 4-pulse stack provides 4 times CEP tuning range to meet the requirements. But for our experiment, it seems not enough now.
The next step is to evaluate the gap to the maximum gain and draw the curve of CEP. Then we will discuss solutions.
|
|
| Attachment 1: Relative_cavity_gain_vs_CEP.png
|  |
| Attachment 2: Gain_vs_CEP.m
|
clear
clc

c=3e8;                      % speed of light

% laser parameters
lambda0=1031.6e-9;          % central wavelength (m)
dlambda0=6.2e-9;            % spectral LW (m)
Frep0=160.3e6;              % laser repetition rate (Hz)
CEP0=0;                     % arbitrary CEP value (rad)

% CVBG parameters
CVBG=3;                      % choose the version of the CVBG
switch CVBG
    case 1
        % N40-05
        lambda1=1031.61e-9;   % central wavelength (m)
        dlambda1=2.2e-9;      % spectral LW (m)
    case 2
        % N40-01
        lambda1=1031.55e-9;   % central wavelength (m)
        dlambda1=1.92e-9;     % spectral LW (m)
    case 3
        %N40-20
        lambda1=1031.64e-9;   % central wavelength (m)
        dlambda1=2.49e-9;     % spectral LW (m)
end
lambda_min=lambda1-dlambda1/2; % minimum wavelength limit of the CVBG
lambda_max=lambda1+dlambda1/2; % maximum wavelength limit of the CVBG

% wavelength vector
lambda=linspace(lambda0-5*dlambda0,lambda0+5*dlambda0,1e5);
% laser power vs wavelentgth
Plas=Plaser(lambda,lambda0,dlambda0,0,1);
% laser power after CVBG vs wavelentgth
Pcvbg=Plaser(lambda,lambda0,dlambda0,lambda_min,lambda_max);

figure(1)
clf
plot(lambda*1e9,Plas)
hold on
plot(lambda*1e9,Pcvbg)
grid on
xlabel('wavelength (nm)')
ylabel('laser power (a.u)')
title('laser spectral power before and after CVBG')
legend('before CVBG','after CVBG')

nmin=floor(c/lambda_max/Frep0);   % minimum laser resonance index
nmax=ceil(c/lambda_min/Frep0);    % maximum laser resonance index
nmean=(nmin+nmax)/2;              % average laser resonance index
nv=nmin:nmax;                     % vector of resonance indexes
flas=(nv+CEP0/2/pi)*Frep0;        % vector of laser frequencies
lambda=c./flas;                   % new vector of wavelength for the laser
% laser power after CVBG vs wavelentgth
Pcvbg=Plaser(lambda,lambda0,dlambda0,lambda_min,lambda_max);

figure(2)
clf
plot(lambda*1e9,Pcvbg)
grid on
xlabel('wavelength (nm)')
ylabel('laser power (a.u)')
title('laser spectral power after CVBG')

% FP-cavity description
FSR=Frep0;          % Free Spectral Range of the FP-cavity
F=23000;            % Finesse of the FP-cavity
LW=FSR/F;           % FP-cavity linewidth definition

N=1e3;              % Nb of CEP simulation steps
cepv=linspace(-2*pi,2*pi,N);    % CEP vector
Gcav=zeros(1,N);                % FP-cavity gain vector initialization
for k=1:N
    dfrep=-cepv(k)/2/pi/(nmean+cepv(k)/2/pi)*FSR; % dfrep = frep - FSR
    df=(nv-nmean).*dfrep;                      % df = flas(n) - n*FSR
    T=Airy(df,LW);                            % power FP-cavity gain vs df
    Gcav(k)=sum(T.*Pcvbg)/sum(Pcvbg);         % total FP-cavity gain
end

figure(3)
clf
hold on
plot(cepv/pi,Gcav)
grid on
xlabel('CEP/pi (rad/rad)')
ylabel('Relative cavity gain (a.u)')
title('Relative cavity gain vs CEP')
%legend('cvbg N40-05','cvbg N40-01','cvbg N40-20')

% Laser power after CVBG function
function Pcvbg=Plaser(lambda,lambda0,dlambda0,lambda_min,lambda_max)
Plas=sech(1.7625*(lambda-lambda0)/dlambda0).^2;
Tcvbg=lambda>=lambda_min & lambda<=lambda_max;
Pcvbg=Plas.*Tcvbg;
end

% FP-cavity Airy function
function T=Airy(df,LW)
T=1./(1+(2*df/LW).^2);
end
|
|
192
|
Mon Feb 26 08:58:33 2024 |
Xinyi Lu | Fixed | info | lasers and optics | Optical room | Menhir pulsed laser locking | Last week, Ronic and I focused on CEP measurements of the menhir laser.
- Measurements without Cavity Locking:
- Direct measurement of repetition rate (Frep) with a spectrum analyzer. Altering the laser pump current from 950mA to 850mA, Frep changed by +28Hz.
- Measurement of the variation of carrier-envelope frequency (Fceo) by beating with CW laser. Altering the laser pump current from 950mA to 850mA resulted in a beating frequency of n0*dFrep + dFceo = +/-2.4MHz, so dFceo ~ 50MHz.
- Measurement with Cavity Locking:
- Maintaining cavity locking, we changed the laser pump current and AOM frequency to record the transmitted power of 5 consecutive fundamental mode (TEM00) resonances.
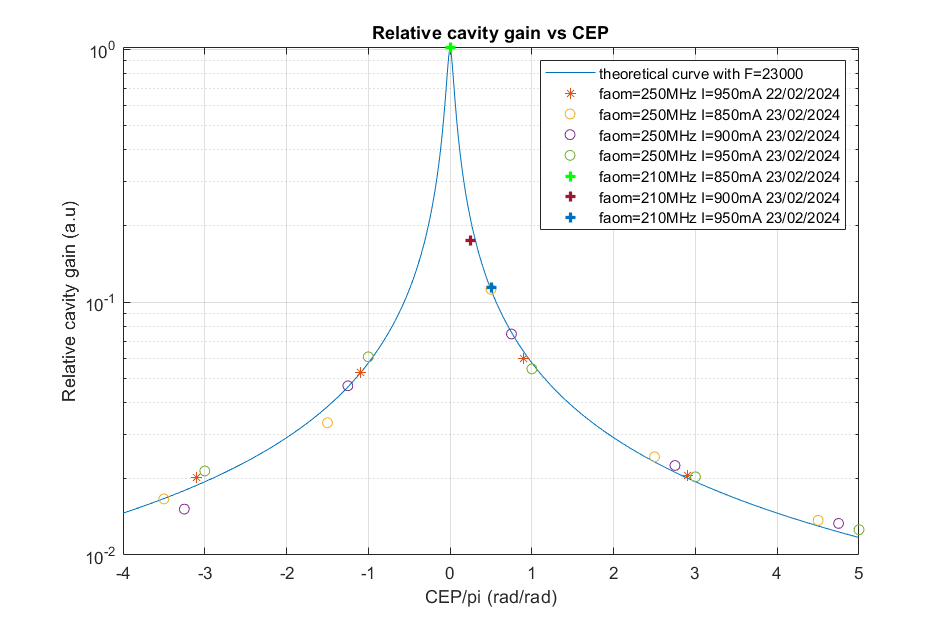
- The pump currents were set to 850 mA, 900 mA and 950 mA, and the AOM frequency were set to 210 MHz and 250 MHz. We then plotted the measured transmission amplitude values against the theoretical gain curve (see Figure 1).
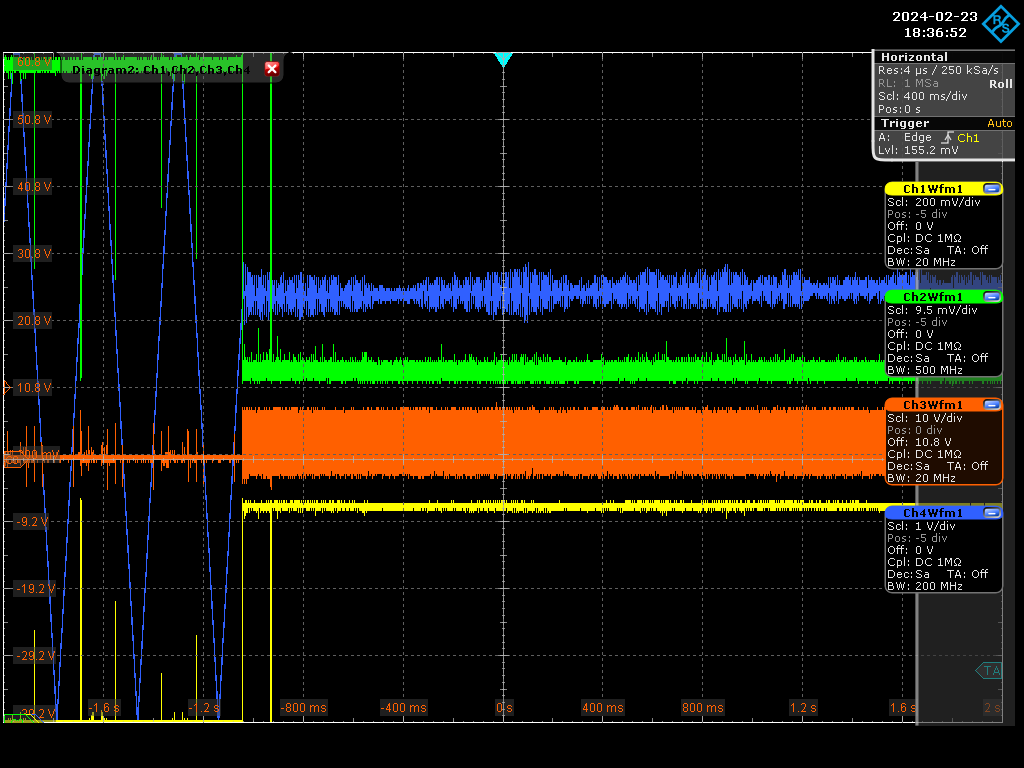
- By adjusting the CEP, we reach the top point on the curve, which is the maximum gain. At this point, the coupling frequency increases from 10% to 50% (see Figure 2).
- We observe that a 100mA change in pump current adjusts the CEP for pi/2, while changing the AOM frequency by +/-40MHz adjusts the CEP for pi. In summary, our CEP tuning range is about 3pi/2 (130 MHz) - not the full 2pi, but still probably giving us maximum gain.
- Next Steps:
- Investigate factors associated with changes in CEP, such as laser temperature or pressure.
- Discuss with Menhir the feasibility of expanding the laser pump current adjustment range (now limited to 100mA).
- Optimize AOM frequency and locking status, connect the amplifier.
| Xinyi Lu wrote: |
|
Here is a simulation of the relative FP-cavity gain vs the CEP for a Finesse of 23000 and taking into account the Menhir laser optical spectrum and several CVBG parameters.
I added the commented Matlab code to produce this plot.
| Xinyi Lu wrote: |
|
These days, Ronic, Daniele and I achieved stable cavity locking with the menhir pulsed laser.
- After vacuuming, the current cavity finesse is now about 23,000. The diameter of the cavity mode is w_x=2.2mm, w_y=2.7mm.
- We had to compensate for frequency drift by manually adjusting the cavity length to keep locking.
Now the problem is that CEP's compensation range is not enough. The laser CEP is drifting from day to day. We adjusted the CEP by tuning the pump current of the menhir laser, but the adjustment range was not enough.
- The laser pump current is varied in the locking state and the variation of repetition rate is recorded. The current range is 850mA to 950mA and the repetition rate changes by 24 Hz. The calculation process is shown in Figure 3.
- By calculation, the variation of CEP caused by the variation of laser current is only π/2, which we hope is 2π.
- For Gamma Factory, the target FSR is 40 MHz, so the 4-pulse stack provides 4 times CEP tuning range to meet the requirements. But for our experiment, it seems not enough now.
The next step is to evaluate the gap to the maximum gain and draw the curve of CEP. Then we will discuss solutions.
|
|
|
| Attachment 1: Gain_vs_CEP.png
|  |
| Attachment 2: Screenshot_2024-02-23_0_183652.png
|  |
|
193
|
Mon Feb 26 16:53:24 2024 |
Xinyi Lu | Fixed | info | lasers and optics | Optical room | Menhir pulsed laser locking | here is the code to get this last curve
| Xinyi Lu wrote: |
|
Last week, Ronic and I focused on CEP measurements of the menhir laser.
- Measurements without Cavity Locking:
- Direct measurement of repetition rate (Frep) with a spectrum analyzer. Altering the laser pump current from 950mA to 850mA, Frep changed by +28Hz.
- Measurement of the variation of carrier-envelope frequency (Fceo) by beating with CW laser. Altering the laser pump current from 950mA to 850mA resulted in a beating frequency of n0*dFrep + dFceo = +/-2.4MHz, so dFceo ~ 50MHz.
- Measurement with Cavity Locking:
- Maintaining cavity locking, we changed the laser pump current and AOM frequency to record the transmitted power of 5 consecutive fundamental mode (TEM00) resonances.
- The pump currents were set to 850 mA, 900 mA and 950 mA, and the AOM frequency were set to 210 MHz and 250 MHz. We then plotted the measured transmission amplitude values against the theoretical gain curve (see Figure 1).
- By adjusting the CEP, we reach the top point on the curve, which is the maximum gain. At this point, the coupling frequency increases from 10% to 50% (see Figure 2).
- We observe that a 100mA change in pump current adjusts the CEP for pi/2, while changing the AOM frequency by +/-40MHz adjusts the CEP for pi. In summary, our CEP tuning range is about 3pi/2 (130 MHz) - not the full 2pi, but still probably giving us maximum gain.
- Next Steps:
- Investigate factors associated with changes in CEP, such as laser temperature or pressure.
- Discuss with Menhir the feasibility of expanding the laser pump current adjustment range (now limited to 100mA).
- Optimize AOM frequency and locking status, connect the amplifier.
| Xinyi Lu wrote: |
|
Here is a simulation of the relative FP-cavity gain vs the CEP for a Finesse of 23000 and taking into account the Menhir laser optical spectrum and several CVBG parameters.
I added the commented Matlab code to produce this plot.
| Xinyi Lu wrote: |
|
These days, Ronic, Daniele and I achieved stable cavity locking with the menhir pulsed laser.
- After vacuuming, the current cavity finesse is now about 23,000. The diameter of the cavity mode is w_x=2.2mm, w_y=2.7mm.
- We had to compensate for frequency drift by manually adjusting the cavity length to keep locking.
Now the problem is that CEP's compensation range is not enough. The laser CEP is drifting from day to day. We adjusted the CEP by tuning the pump current of the menhir laser, but the adjustment range was not enough.
- The laser pump current is varied in the locking state and the variation of repetition rate is recorded. The current range is 850mA to 950mA and the repetition rate changes by 24 Hz. The calculation process is shown in Figure 3.
- By calculation, the variation of CEP caused by the variation of laser current is only π/2, which we hope is 2π.
- For Gamma Factory, the target FSR is 40 MHz, so the 4-pulse stack provides 4 times CEP tuning range to meet the requirements. But for our experiment, it seems not enough now.
The next step is to evaluate the gap to the maximum gain and draw the curve of CEP. Then we will discuss solutions.
|
|
|
|
| Attachment 1: Gain_vs_CEP.m
|
clear
clc

c=3e8;                      % speed of light

% laser parameters
lambda0=1031.6e-9;          % central wavelength (m)
dlambda0=6.2e-9;            % spectral LW (m)
Frep0=160.3e6;              % laser repetition rate (Hz)
CEP0=0;                     % arbitrary CEP value (rad)

% CVBG parameters
CVBG=3;                      % choose the version of the CVBG
switch CVBG
    case 1
        % N40-05
        lambda1=1031.61e-9;   % central wavelength (m)
        dlambda1=2.2e-9;      % spectral LW (m)
    case 2
        % N40-01
        lambda1=1031.55e-9;   % central wavelength (m)
        dlambda1=1.92e-9;     % spectral LW (m)
    case 3
        %N40-20
        lambda1=1031.64e-9;   % central wavelength (m)
        dlambda1=2.49e-9;     % spectral LW (m)
end
lambda_min=lambda1-dlambda1/2; % minimum wavelength limit of the CVBG
lambda_max=lambda1+dlambda1/2; % maximum wavelength limit of the CVBG

% wavelength vector
lambda=linspace(lambda0-5*dlambda0,lambda0+5*dlambda0,1e5);
% laser power vs wavelentgth
Plas=Plaser(lambda,lambda0,dlambda0,0,1);
% laser power after CVBG vs wavelentgth
Pcvbg=Plaser(lambda,lambda0,dlambda0,lambda_min,lambda_max);

figure(1)
clf
plot(lambda*1e9,Plas)
hold on
plot(lambda*1e9,Pcvbg)
grid on
xlabel('wavelength (nm)')
ylabel('laser power (a.u)')
title('laser spectral power before and after CVBG')
legend('before CVBG','after CVBG')

nmin=floor(c/lambda_max/Frep0);   % minimum laser resonance index
nmax=ceil(c/lambda_min/Frep0);    % maximum laser resonance index
nmean=(nmin+nmax)/2;              % average laser resonance index
nv=nmin:nmax;                     % vector of resonance indexes
flas=(nv+CEP0/2/pi)*Frep0;        % vector of laser frequencies
lambda=c./flas;                   % new vector of wavelength for the laser
% laser power after CVBG vs wavelentgth
Pcvbg=Plaser(lambda,lambda0,dlambda0,lambda_min,lambda_max);

figure(2)
clf
plot(lambda*1e9,Pcvbg)
grid on
xlabel('wavelength (nm)')
ylabel('laser power (a.u)')
title('laser spectral power after CVBG')

% FP-cavity description
FSR=Frep0;          % Free Spectral Range of the FP-cavity
F=23000;            % Finesse of the FP-cavity
LW=FSR/F;           % FP-cavity linewidth definition

N=1e3;              % Nb of CEP simulation steps
cepv=linspace(-4*pi,5*pi,N);    % CEP vector
Gcav=zeros(1,N);                % FP-cavity gain vector initialization
for k=1:N
    dfrep=-cepv(k)/2/pi/(nmean+cepv(k)/2/pi)*FSR; % dfrep = frep - FSR
    df=(nv-nmean).*dfrep;                      % df = flas(n) - n*FSR
    T=Airy(df,LW);                            % power FP-cavity gain vs df
    Gcav(k)=sum(T.*Pcvbg)/sum(Pcvbg);         % total FP-cavity gain
end

figure(3)
clf
semilogy(cepv/pi,Gcav)
grid on
xlabel('CEP/pi (rad/rad)')
ylabel('Relative cavity gain (a.u)')
title('Relative cavity gain vs CEP')
%legend('cvbg N40-05','cvbg N40-01','cvbg N40-20')
hold on

%% measurements
% dfrep = +28Hz (frep@950mA - frep@850mA) => dCEP = -2rad

% measurements on 22/02/2024 Vinput=30mV
Idm=[0 1 2 3];
Vm=[63 164 185 64]/3100;
semilogy((Idm-1.55)*2,Vm,'*')

% measurements on 23/02/2024 Vinput=30mV
V0=2700;
NIdm=[0 1 2 3 4];
V850m=[45 90 303 66 37]/V0;
V900m=[41 126 202 61 36]/V0;
V950m=[58 164 147 55 34]/V0;
semilogy(NIdm*2-3.5,V850m,'o')
semilogy(NIdm*2-3.25,V900m,'o')
semilogy(NIdm*2-3,V950m,'o')

% measurements on 23/02/2024 Vinput=94mV
V1=650;
Vn850m=663/V1;
Vn900m=114/V1;
Vn950m=74/V1;
semilogy(0,Vn850m,'g+','linewidth',2)
semilogy(0.25,Vn900m,'+','linewidth',2)
semilogy(0.5,Vn950m,'+','linewidth',2)

legend('theoretical curve with F=23000','faom=250MHz I=950mA 22/02/2024', ...
'faom=250MHz I=850mA 23/02/2024','faom=250MHz I=900mA 23/02/2024','faom=250MHz I=950mA 23/02/2024', ...
'faom=210MHz I=850mA 23/02/2024','faom=210MHz I=900mA 23/02/2024','faom=210MHz I=950mA 23/02/2024')

% Laser power after CVBG function
function Pcvbg=Plaser(lambda,lambda0,dlambda0,lambda_min,lambda_max)
Plas=sech(1.7625*(lambda-lambda0)/dlambda0).^2;
Tcvbg=lambda>=lambda_min & lambda<=lambda_max;
Pcvbg=Plas.*Tcvbg;
end

% FP-cavity Airy function
function T=Airy(df,LW)
T=1./(1+(2*df/LW).^2);
end
|
|
99
|
Tue Jun 21 23:52:28 2022 |
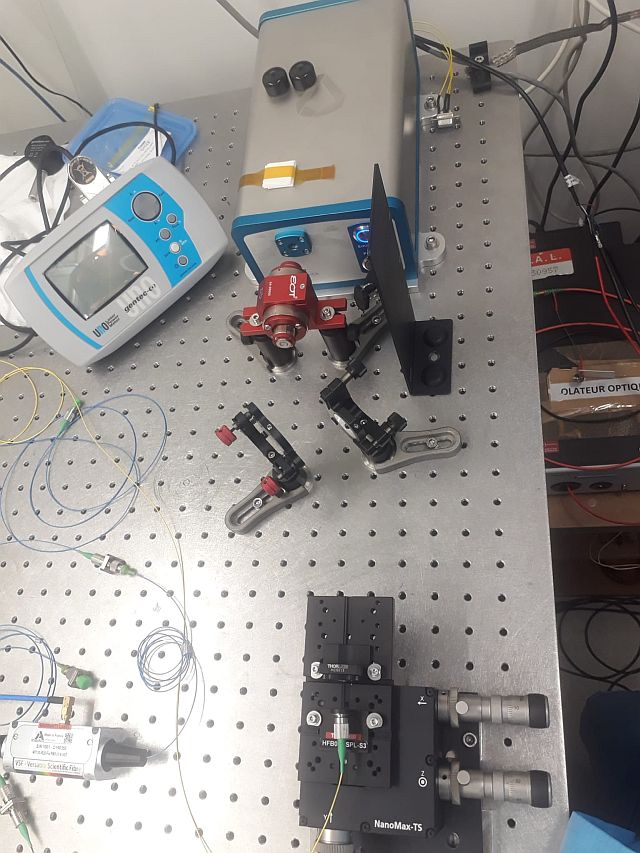
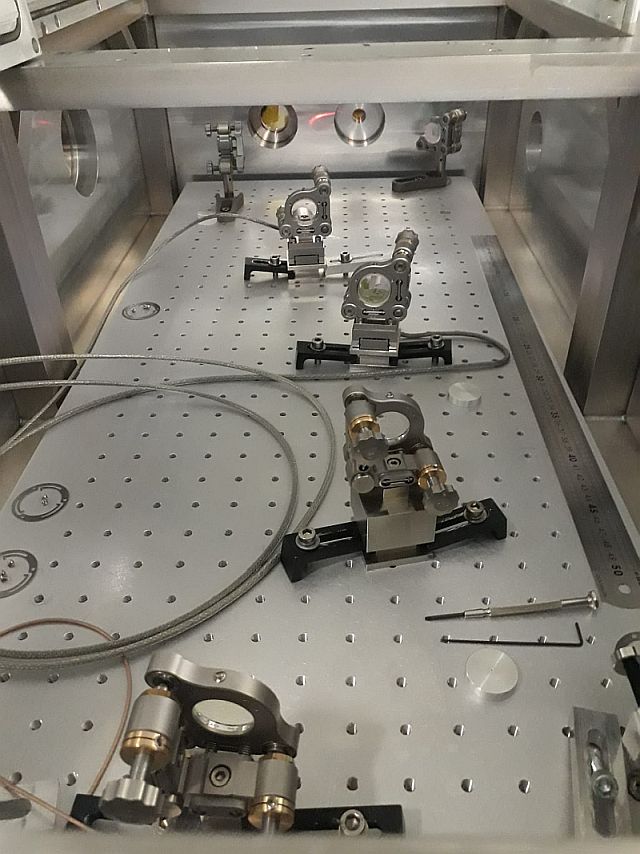
Manar Amer | Fixed | report | mechanics | lasers and optics | detectors and electronics | Optical room | Menhir Pulsed Laser | The SBox Length (FSR), was changed to match the repetition rate of the Menhir pulsed laser Frep = 216.6625 MHz
It was changed by removing the 2 D-shaped mirrors placed between M1 and M2, distance between M1-M2 ~= 169 mm
it was still needed to be adjusted with M1 motor to reach the correct FSR.
The pulsed laser is placed on the able with injection into a fiber
The Finesse of the cavity has progressed from ~2500 to ~ 18 000
** Note: PowerPoint attached shows the progress over the last two weeks on the laser and |
| Attachment 1: MENHIR_injection_into_fiber.jpg
|  |
| Attachment 2: SBox_M.jpg
|  |
| Attachment 3: 20220620_SBox_MENHIR.pptx
|
|
227
|
Fri Nov 29 16:50:04 2024 |
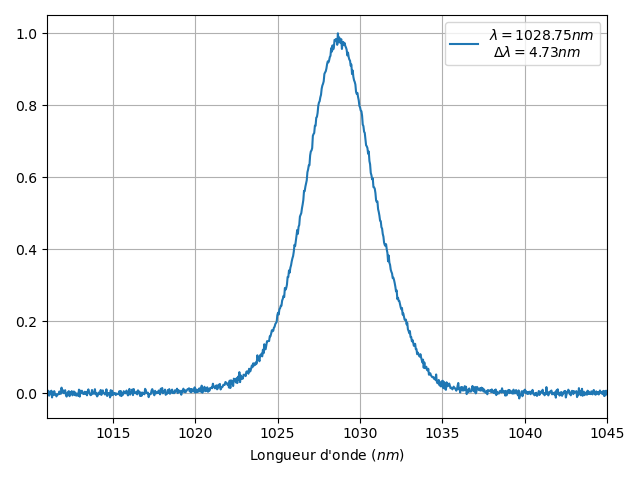
Alice Renaux | Under Process | info | lasers and optics | Optical room | Menhir 216MHz laser | The Menhir 216MHz laser has been put back in place on the cavity table. Its output power is measured to be 160mW with an attenuator. Its spectrum is available in "spectre.xlsx" and "spectre.png". The main wavelength is a bit shorter (1028.75nm) and the spectrum a bit narrower (4.73nm) than expected.
|
| Attachment 1: spectre.xlsx
|
| Attachment 2: spectre.png
|  |
|
226
|
Fri Nov 29 12:06:05 2024 |
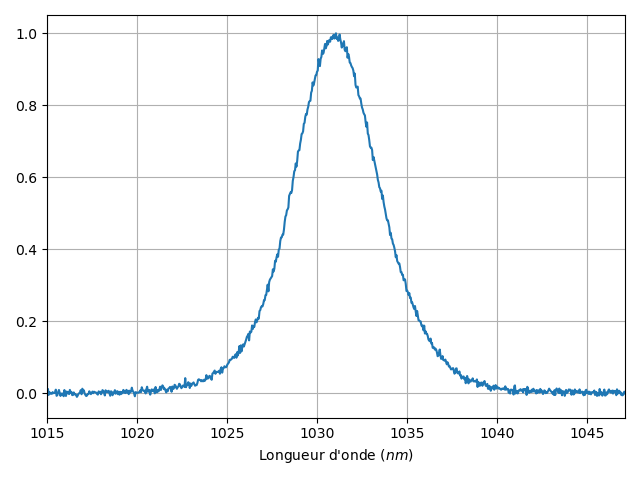
Alice Renaux | Fixed | info | lasers and optics | Optical room | Menhir 160MHz laser | The Menhir 160MHz has been put back in place on the CELIA amplifier setup. Its output power is measured to be 150-160mW with an attenuator as expected. Its spectrum is available in "spectre_avant_cvbg.xlsx" and "spectre_avant_cvbg.png".
The pulses are stretched by means of a CVBG. Their spectrum is available in "spectre_apres_cvbg.xlsx" and "spectre_apres_cvbg.png".
The laser is coupled into an optical fiber with an output power of 11.5mW for a 32mW input.
|
| Attachment 1: spectre_avant_cvbg.xlsx
|
| Attachment 2: spectre_apres_cvbg.xlsx
|
| Attachment 3: spectre_avant_cvbg.png
|  |
| Attachment 4: spectre_apres_cvbg.png
| 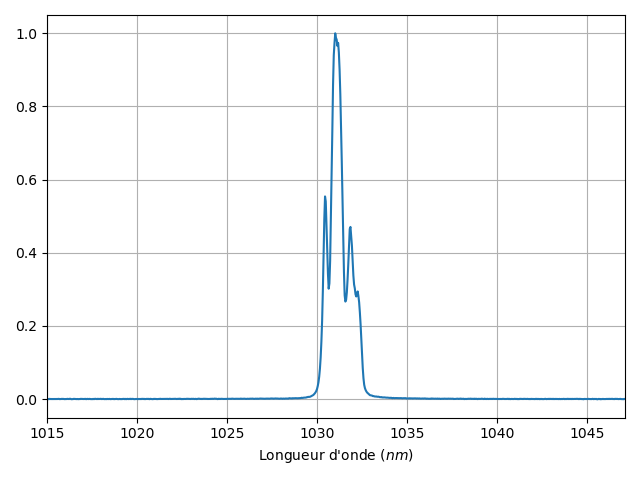 |
|
28
|
Fri Feb 1 14:04:27 2019 |
Loïc Amoudry | Fixed | info | lasers and optics | Other | Meeting with LMA people, AFM | 30/01/19 - The following powerpoint shows the results discussed with LMA people.
What came out from the discussion is:
- Their cleaning method uses demineralized water drop on a spinner. It is probably the explanation of the circular traces on the mirror's surfaces but we still don't know what is this deposit (XPS is running out on 2 of this mirrors at this time).
- According to their point of view, the spots could come from the coating deposition technique and are "normal". No real explaination, should not come from the substrat which is ultra-polished but can come from some clustering in the coating.
We gave them 2 of the mirrors so they can check if it is possible to clean them. They'll also do a measurement of the mirror's topology. |
| Attachment 1: POINT_SUR_LES_MIROIRS.pptx
|
|
19
|
Wed Oct 31 14:03:22 2018 |
Loïc Amoudry | Fixed | report | lasers and optics | Optical room | M4 transmission measurement | The kept transmission for M4 is 2.17 ppm. Which is the value measured after alignement (center of the mirror).
These measurements have been taken before alignement.
| I (A) |
Input power (mW) |
Transmitted power after window (mW) |
Transmission (ppm) |
| 0 |
74.3 |
195.2e-6 |
2.63 |
| 0 |
73.5 |
212.8e-6 |
2.89 |
| 0 |
52.4 |
151e-6 |
2.88 |
| 6 |
28 400 |
72e-3 |
2.54 |
High dependence against the position. Few measurement several mm away from the center each one at different position give 194, 193, 208, 200 ppm. |
|
20
|
Wed Oct 31 14:04:50 2018 |
Loïc Amoudry | Fixed | report | lasers and optics | Optical room | M4 transmission measurement |
| Loïc Amoudry wrote: |
|
The kept transmission for M4 is 2.17 ppm. Which is the value measured after alignement (center of the mirror).
These measurements have been taken before alignement.
| I (A) |
Input power (mW) |
Transmitted power after window (mW) |
Transmission (ppm) |
| 0 |
74.3 |
195.2e-6 |
2.63 |
| 0 |
73.5 |
212.8e-6 |
2.89 |
| 0 |
52.4 |
151e-6 |
2.88 |
| 6 |
28 400 |
72e-3 |
2.54 |
High dependence against the position. Few measurement several mm away from the center each one at different position give 2.86, 2.68, 2.93, 3.01, 3.06, 3.35 ppm.
|
|
|
172
|
Wed Sep 28 18:43:51 2022 |
Manar Amer | Fixed | report | lasers and optics | Optical room | M2 ThomX spherical Cleaning | Today, M2 Spherical-3 from ThomX that was installed inside the SBox was removed, there was one big dust on the surface of the mirror, mirror was cleaned
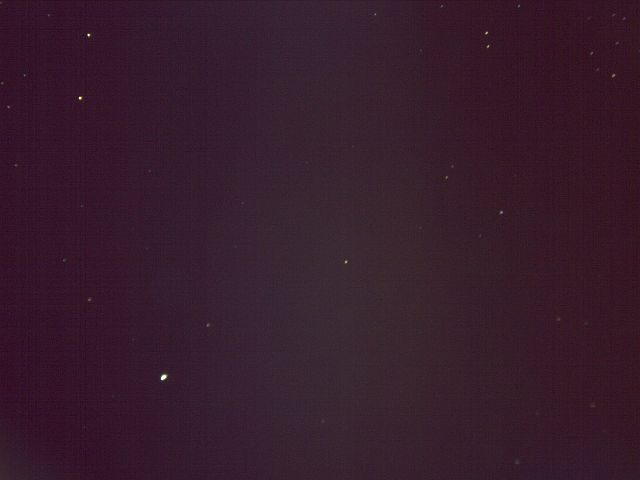
using pure ethanol and pure water with spincoater. (images taken with arrow far from us)
M1 from Gamma factory, fixed with the addition of the ring with 3 screws.
The mode was immediately seen after, did not have to align. After locking the cavity, we do not see the degeneracy resonance we saw yesterday.
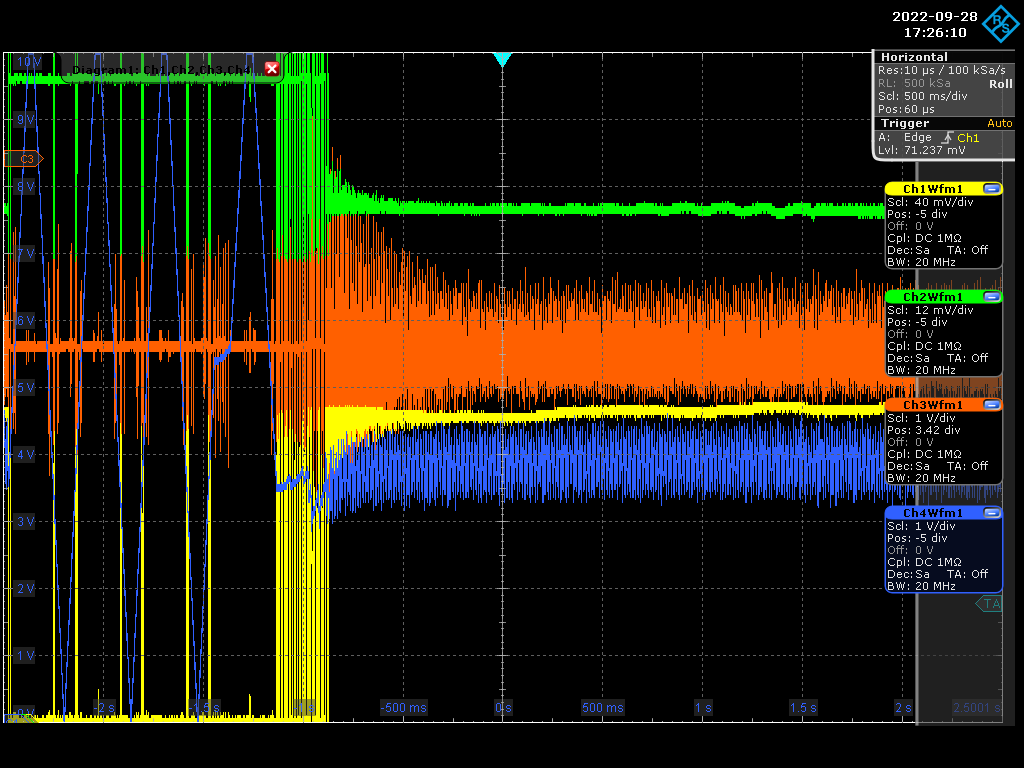
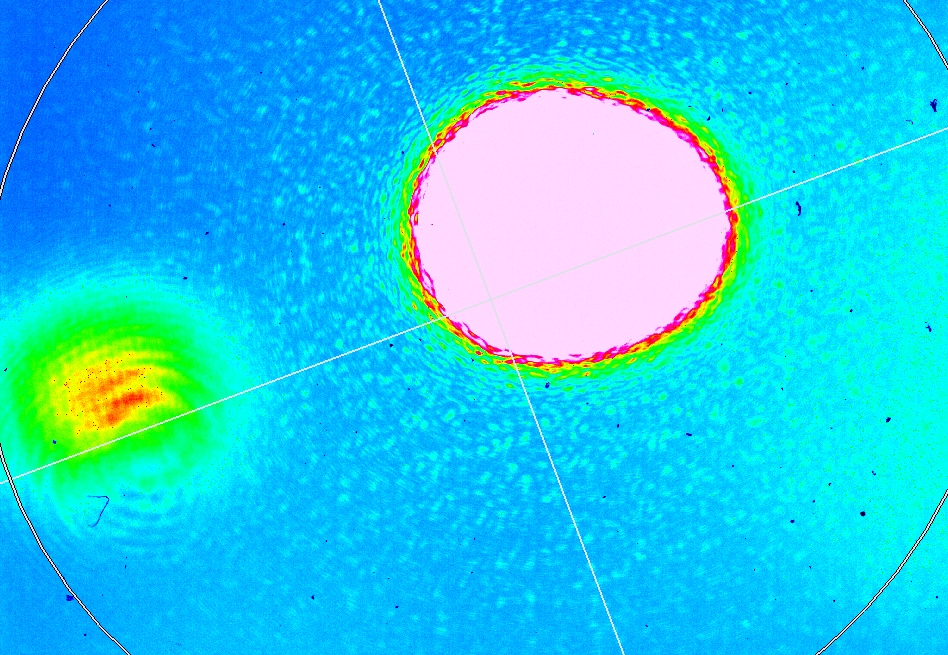
But we still see the spot on the bottom left of the mode in transmission. The integration time for both centers maximums were 0.34 for mode and 200 for spot.
After optimizing the polarization and the CEP, we managed to get a coupling of ~ 25%
| Manar Amer wrote: |
|
In the morning, Vacuum broken and rotated M1 ThomX 90 degrees clockwise, locked the cavity in air and we observe a degeneracy close to the fundamental mode.
In the afternoon, I cleaned M1 from Gamma factory using pure ethanol and pure water with the spincoater
then placed it as the coupling mirror, aligned and locked in air. we observed similar degeneracy to before next to the fundamental mode.
During the process, M2 spherical from ThomX installed in the cavity was not changed. There could be damage on it, will investigate tomorrow.
| Manar Amer wrote: |
|
On Wednesday 21st , I opened the cavity did an additional 2 mm shift of the injection mirror and put it under vacuum again.
Locked the cavity, and observed the transmitted beam.
The second spot is still visible on the beam profiler , the distance difference between the 2 spots is ~ 5.2 mm (the same as before )
no difference in distance, decreases the likelihood that it is from the damage (to be investigated more)
in addition, we have locked at the reflection from the cavity to confirm the spot next to the beam.
We took two images when the laser was locked with the cavity and when it was not.
We clearly see that the spot is indeed related to the mode of the cavity. And probably the damaged spot.
(Difference is size on the reflection image is due to the distance is larger than the transmission + the spherical mirror effect is not there)
| Manar Amer wrote: |
|
To compare between the 2 images of the cavity mode:
- the mode by itself has an integration time of 0.06 ms, position (x, y) = (1142.969, -53.932) um on the beam profiler
- the mode saturated with the spot next to it almost at max intensity has an integration time of 50 ms, position (-3700, -2000) um
comparing the positions of both spots, they have difference (4842.969, 2053.932) um
------ > total difference on the beam profiler ~ 5.3 mm , the distance from the spherical mirror to the beam profiler is ~ 40 cm
| Manar Amer wrote: |
|
Yesterday , we locked the cavity and we see a sign of a high finesse on the transmission signal, but no measurement of Finesse was done.
we have a coupling of ~ 45%, which is a loss of 20% from the previous coupling of 60%
an estimate done by Ronic MATLAB simulation for the coupling drop where we have 200 pp additional losses and gain of 2.6 k we should get a transmission of 1.1 mW for injected power of ~ 300 mW
which is consistent with the power measured after a 50% beam splitter on transmission we got 0.51 mW (total would be 1.02mW)
in addition, there is a beam that is next to the mode of the cavity , confirmed it was not a reflection from the beam splitter or the optics.
it could be that we are still close to the damaged spot ?
| Manar Amer wrote: |
|
ThomX injection mirror has been cleaned and placed again inside the optical cavity.
This time to avoid the damaged spot I have displaced the mirror mount horizontally to have a distance between center of the beam and the spot ~ 2.5 - 3 mm.
The alignment was affected slightly but recovered by adjusting the mirror mount nobs, (00 mode observed in air)
The cavity was closed is being pumped with vacuum.
To be done: adjust the cavity length and find the resonance, improve the outer alignment, lock the cavity
| Manar Amer wrote: |
|
a better image of the damaged spot, image taken with the arrow for the reflective surface facing the other direction (image shows position)
The image of M1 for ThomX reflective surface was taken at min zoom (full image scale 13 mm) and max zoom (full image scale 2 mm) on microscope
The spot appears to be not close to the center of the mirror, at max zoom in the center we do not see the spot it is just out of the image
the last image has the mirror position adjusted to center the damaged spot for a better image of it.
| Manar Amer wrote: |
|
After discussing, we have decided against shifting the mirror to avoid the time lost.
We changed the injection mirror to a different mirror from Mighty Laser set, Transmission of mirror 80 ppm. (no visible damage at the center of the mirror, only a small scratch on the back)
mirror cleaned using pure ethanol and pure water with spin coater, also the spherical mirror was cleaned again.
| Manar Amer wrote: |
|
Tomorrow will try to shift the injection mirror to avoid hitting the damaged spot.
| Manar Amer wrote: |
|
Following the storage of ~ 50 kW inside the cavity and a sudden drop in transmitted power from the cavity
damage to the mirror surface was suspected.
We broke vacuum and took images of the surface of the 2 mirrors in the cavity, the spherical and the planar mirror
image 1 , spherical reflective surface (no visible damage with the UV light, and no visible damage under the microscope)
image 2 , planar coupler mirror reflective surface (no visible damage under UV light, but under the microscope there is a damaged spot close to the center)
image 4 is the planar surface reflective surface at zoom 8 on the microscope.
|
|
|
|
|
|
|
|
|
|
| Attachment 1: MS_directfromcavity_reduceSize.jpg
|  |
| Attachment 2: MS_afteralcholeswipe_reducedSize.jpg
|  |
| Attachment 3: Screenshot_2022-09-28_0_172610.png
|  |
| Attachment 4: 00mode0point34ms_transmission.jpg
|  |
| Attachment 5: 00mode_200ms.jpg
|  |
| Attachment 6: reflection_lock.jpg
|  |
|
17
|
Wed Oct 31 13:48:58 2018 |
Loïc Amoudry | Fixed | report | lasers and optics | Optical room | M1 transmission measurement | Center of M1:
| I (A) |
Input power (mW) |
Transmitted power (mW) |
Transmission (ppm) |
| 0 |
78 |
0.01477 |
189 |
| 4 |
16500 |
3.2 |
194 |
|
|
21
|
Wed Oct 31 14:06:17 2018 |
Loïc Amoudry | Fixed | report | lasers and optics | Optical room | M1 transmission measurement | At different positions, transmission give 194, 193, 208, 200 ppm?
| Loïc Amoudry wrote: |
|
Center of M1:
| I (A) |
Input power (mW) |
Transmitted power (mW) |
Transmission (ppm) |
| 0 |
78 |
0.01477 |
189 |
| 4 |
16500 |
3.2 |
194 |
|
|
|
168
|
Tue Sep 20 12:50:40 2022 |
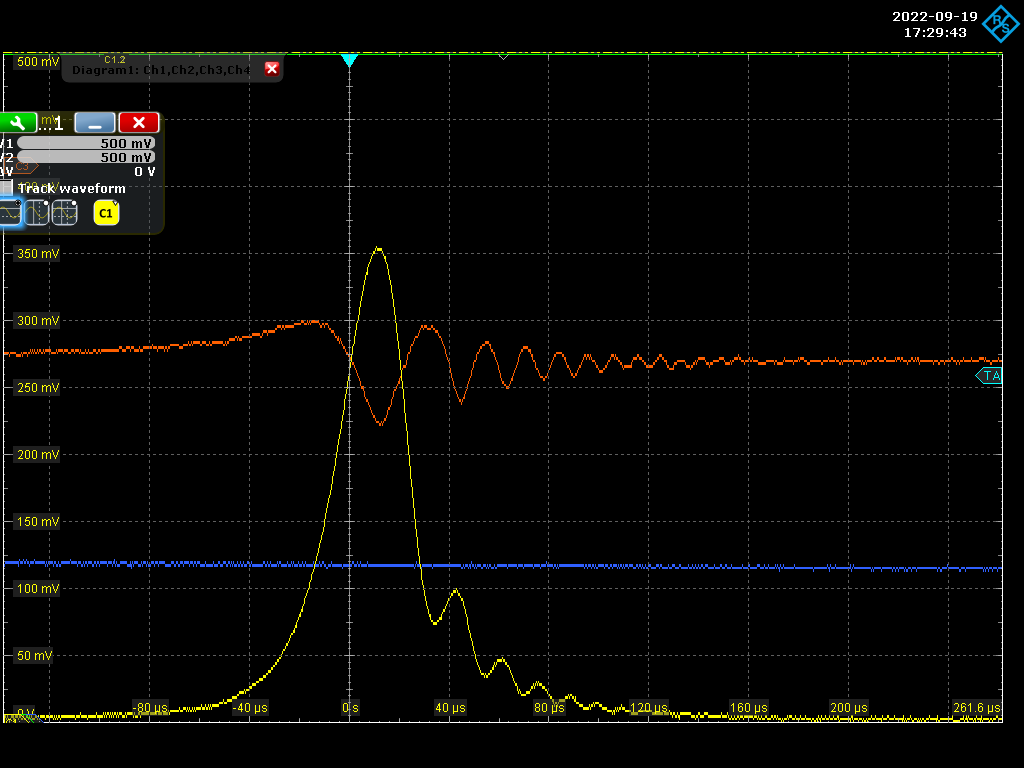
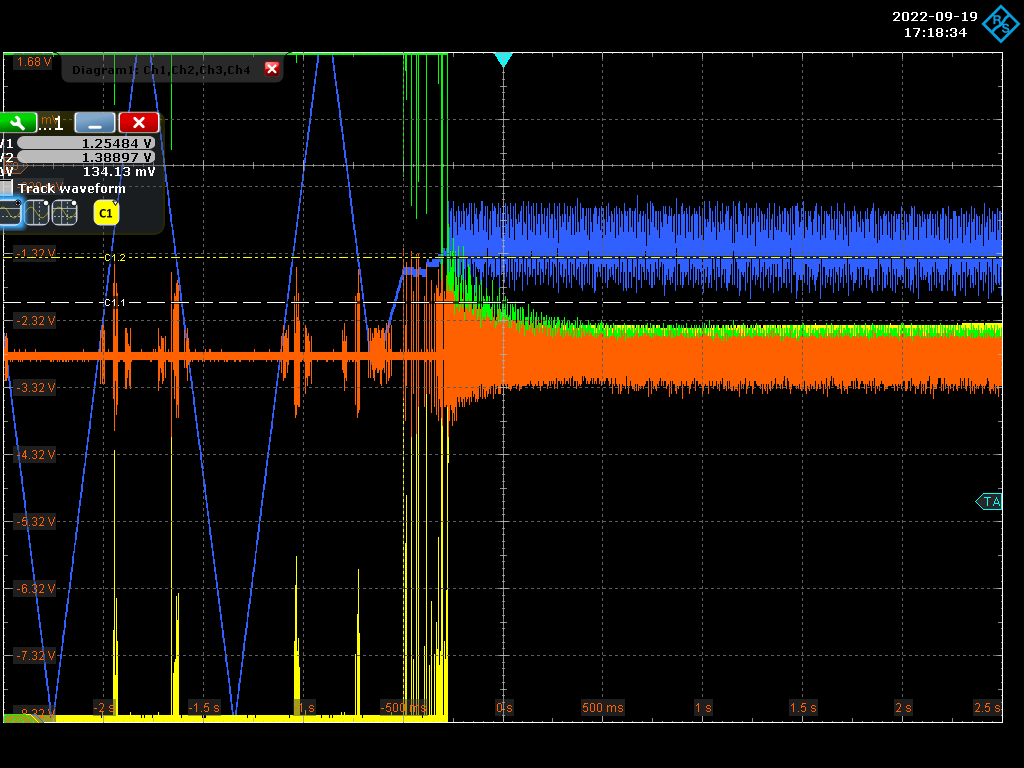
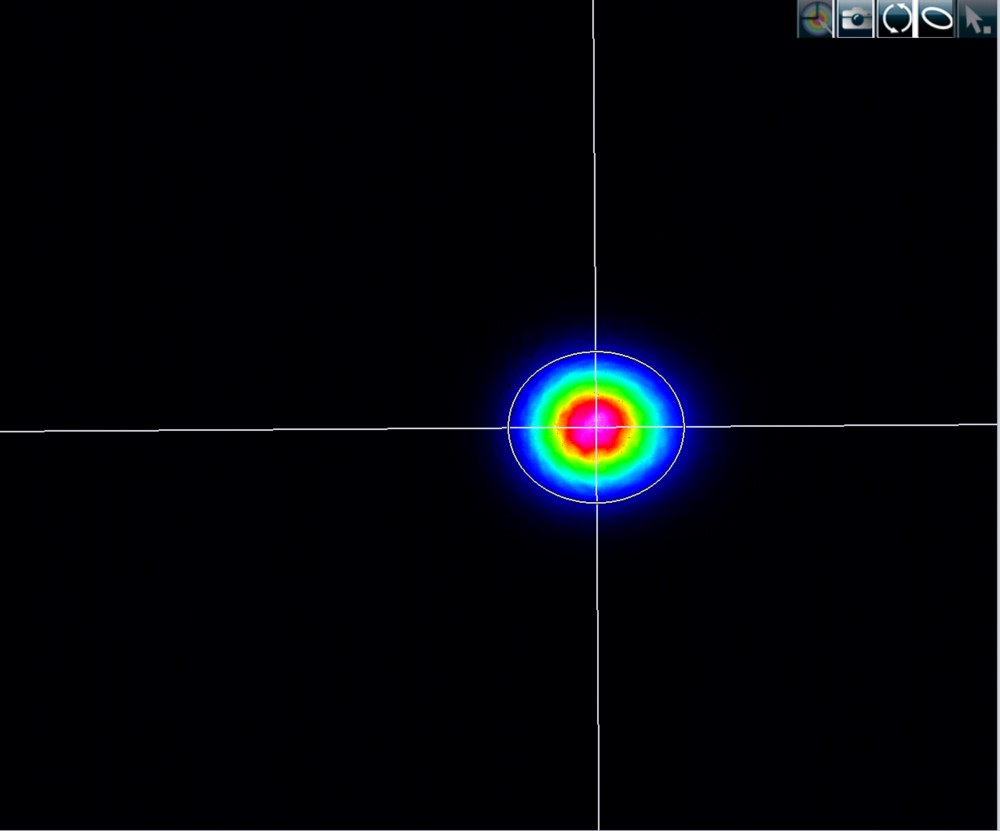
Manar Amer | Fixed | report | lasers and optics | Optical room | M1 ThomX used while shifted from damaged spot | Yesterday , we locked the cavity and we see a sign of a high finesse on the transmission signal, but no measurement of Finesse was done.
we have a coupling of ~ 45%, which is a loss of 20% from the previous coupling of 60%
an estimate done by Ronic MATLAB simulation for the coupling drop where we have 200 pp additional losses and gain of 2.6 k we should get a transmission of 1.1 mW for injected power of ~ 300 mW
which is consistent with the power measured after a 50% beam splitter on transmission we got 0.51 mW (total would be 1.02mW)
in addition, there is a beam that is next to the mode of the cavity , confirmed it was not a reflection from the beam splitter or the optics.
it could be that we are still close to the damaged spot ?
| Manar Amer wrote: |
|
ThomX injection mirror has been cleaned and placed again inside the optical cavity.
This time to avoid the damaged spot I have displaced the mirror mount horizontally to have a distance between center of the beam and the spot ~ 2.5 - 3 mm.
The alignment was affected slightly but recovered by adjusting the mirror mount nobs, (00 mode observed in air)
The cavity was closed is being pumped with vacuum.
To be done: adjust the cavity length and find the resonance, improve the outer alignment, lock the cavity
| Manar Amer wrote: |
|
a better image of the damaged spot, image taken with the arrow for the reflective surface facing the other direction (image shows position)
The image of M1 for ThomX reflective surface was taken at min zoom (full image scale 13 mm) and max zoom (full image scale 2 mm) on microscope
The spot appears to be not close to the center of the mirror, at max zoom in the center we do not see the spot it is just out of the image
the last image has the mirror position adjusted to center the damaged spot for a better image of it.
| Manar Amer wrote: |
|
After discussing, we have decided against shifting the mirror to avoid the time lost.
We changed the injection mirror to a different mirror from Mighty Laser set, Transmission of mirror 80 ppm. (no visible damage at the center of the mirror, only a small scratch on the back)
mirror cleaned using pure ethanol and pure water with spin coater, also the spherical mirror was cleaned again.
| Manar Amer wrote: |
|
Tomorrow will try to shift the injection mirror to avoid hitting the damaged spot.
| Manar Amer wrote: |
|
Following the storage of ~ 50 kW inside the cavity and a sudden drop in transmitted power from the cavity
damage to the mirror surface was suspected.
We broke vacuum and took images of the surface of the 2 mirrors in the cavity, the spherical and the planar mirror
image 1 , spherical reflective surface (no visible damage with the UV light, and no visible damage under the microscope)
image 2 , planar coupler mirror reflective surface (no visible damage under UV light, but under the microscope there is a damaged spot close to the center)
image 4 is the planar surface reflective surface at zoom 8 on the microscope.
|
|
|
|
|
|
| Attachment 1: Screenshot_2022-09-19_2_172943.png
|  |
| Attachment 2: Screenshot_2022-09-19_1_171834.png
|  |
| Attachment 3: 00mode_LOCK.jpg
|  |
| Attachment 4: 00mode_LOCK_saturaed.jpg
|  |
|
169
|
Wed Sep 21 12:10:07 2022 |
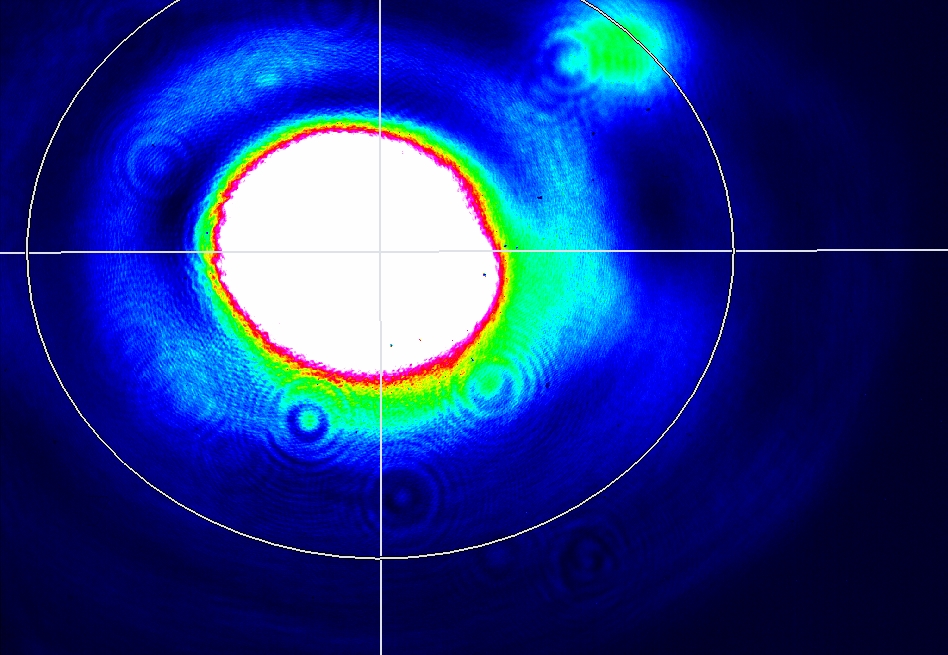
Manar Amer | Fixed | report | lasers and optics | Optical room | M1 ThomX used while shifted from damaged spot | To compare between the 2 images of the cavity mode:
- the mode by itself has an integration time of 0.06 ms, position (x, y) = (1142.969, -53.932) um on the beam profiler
- the mode saturated with the spot next to it almost at max intensity has an integration time of 50 ms, position (-3700, -2000) um
comparing the positions of both spots, they have difference (4842.969, 2053.932) um
------ > total difference on the beam profiler ~ 5.3 mm , the distance from the spherical mirror to the beam profiler is ~ 40 cm
| Manar Amer wrote: |
|
Yesterday , we locked the cavity and we see a sign of a high finesse on the transmission signal, but no measurement of Finesse was done.
we have a coupling of ~ 45%, which is a loss of 20% from the previous coupling of 60%
an estimate done by Ronic MATLAB simulation for the coupling drop where we have 200 pp additional losses and gain of 2.6 k we should get a transmission of 1.1 mW for injected power of ~ 300 mW
which is consistent with the power measured after a 50% beam splitter on transmission we got 0.51 mW (total would be 1.02mW)
in addition, there is a beam that is next to the mode of the cavity , confirmed it was not a reflection from the beam splitter or the optics.
it could be that we are still close to the damaged spot ?
| Manar Amer wrote: |
|
ThomX injection mirror has been cleaned and placed again inside the optical cavity.
This time to avoid the damaged spot I have displaced the mirror mount horizontally to have a distance between center of the beam and the spot ~ 2.5 - 3 mm.
The alignment was affected slightly but recovered by adjusting the mirror mount nobs, (00 mode observed in air)
The cavity was closed is being pumped with vacuum.
To be done: adjust the cavity length and find the resonance, improve the outer alignment, lock the cavity
| Manar Amer wrote: |
|
a better image of the damaged spot, image taken with the arrow for the reflective surface facing the other direction (image shows position)
The image of M1 for ThomX reflective surface was taken at min zoom (full image scale 13 mm) and max zoom (full image scale 2 mm) on microscope
The spot appears to be not close to the center of the mirror, at max zoom in the center we do not see the spot it is just out of the image
the last image has the mirror position adjusted to center the damaged spot for a better image of it.
| Manar Amer wrote: |
|
After discussing, we have decided against shifting the mirror to avoid the time lost.
We changed the injection mirror to a different mirror from Mighty Laser set, Transmission of mirror 80 ppm. (no visible damage at the center of the mirror, only a small scratch on the back)
mirror cleaned using pure ethanol and pure water with spin coater, also the spherical mirror was cleaned again.
| Manar Amer wrote: |
|
Tomorrow will try to shift the injection mirror to avoid hitting the damaged spot.
| Manar Amer wrote: |
|
Following the storage of ~ 50 kW inside the cavity and a sudden drop in transmitted power from the cavity
damage to the mirror surface was suspected.
We broke vacuum and took images of the surface of the 2 mirrors in the cavity, the spherical and the planar mirror
image 1 , spherical reflective surface (no visible damage with the UV light, and no visible damage under the microscope)
image 2 , planar coupler mirror reflective surface (no visible damage under UV light, but under the microscope there is a damaged spot close to the center)
image 4 is the planar surface reflective surface at zoom 8 on the microscope.
|
|
|
|
|
|
|
|
170
|
Mon Sep 26 16:15:06 2022 |
Manar Amer | Fixed | report | lasers and optics | Optical room | M1 ThomX used while shifted from damaged spot | On Wednesday 21st , I opened the cavity did an additional 2 mm shift of the injection mirror and put it under vacuum again.
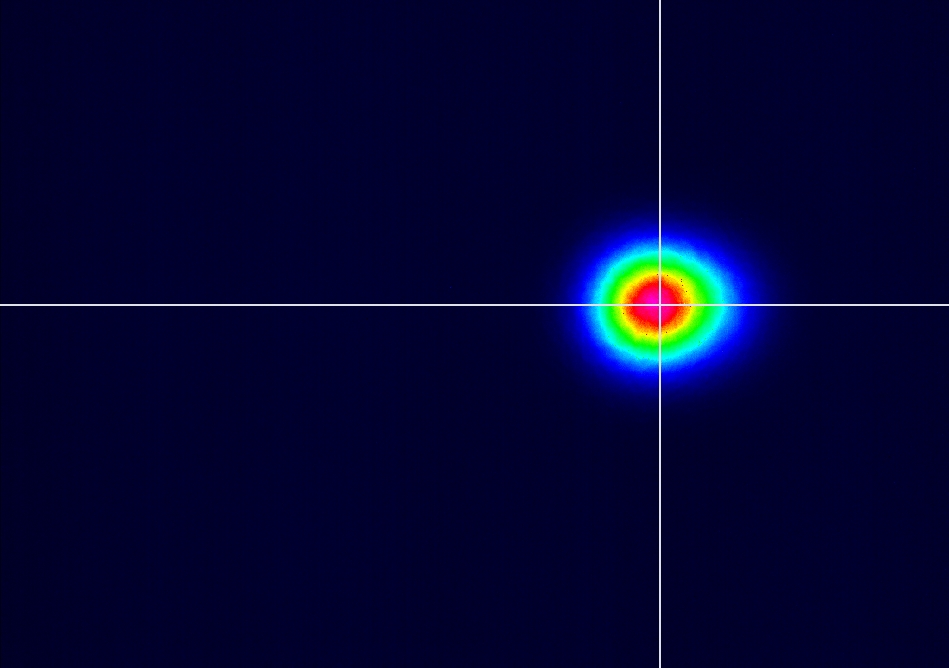
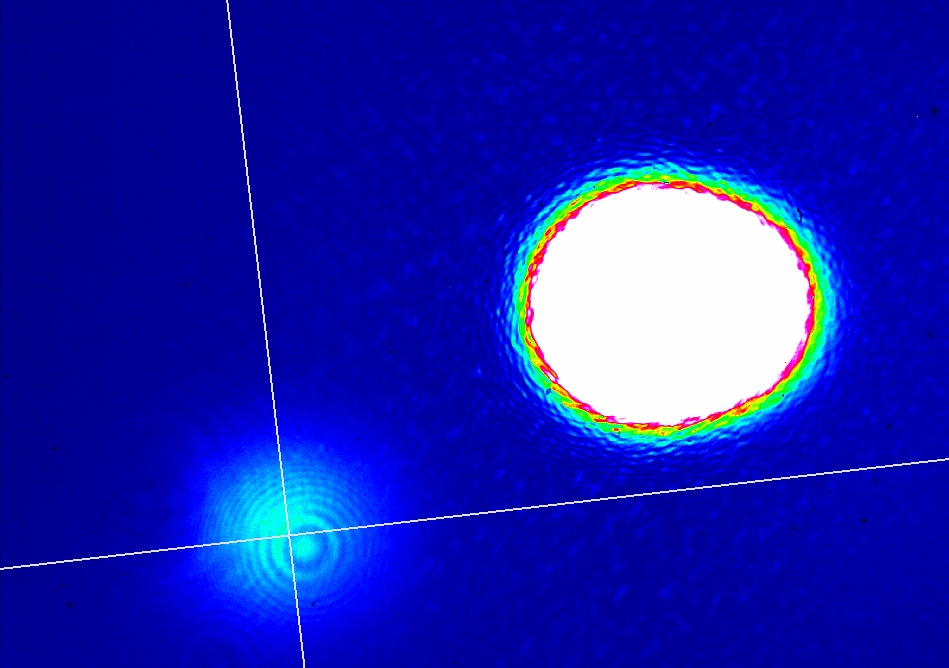
Locked the cavity, and observed the transmitted beam.
The second spot is still visible on the beam profiler , the distance difference between the 2 spots is ~ 5.2 mm (the same as before )
no difference in distance, decreases the likelihood that it is from the damage (to be investigated more)
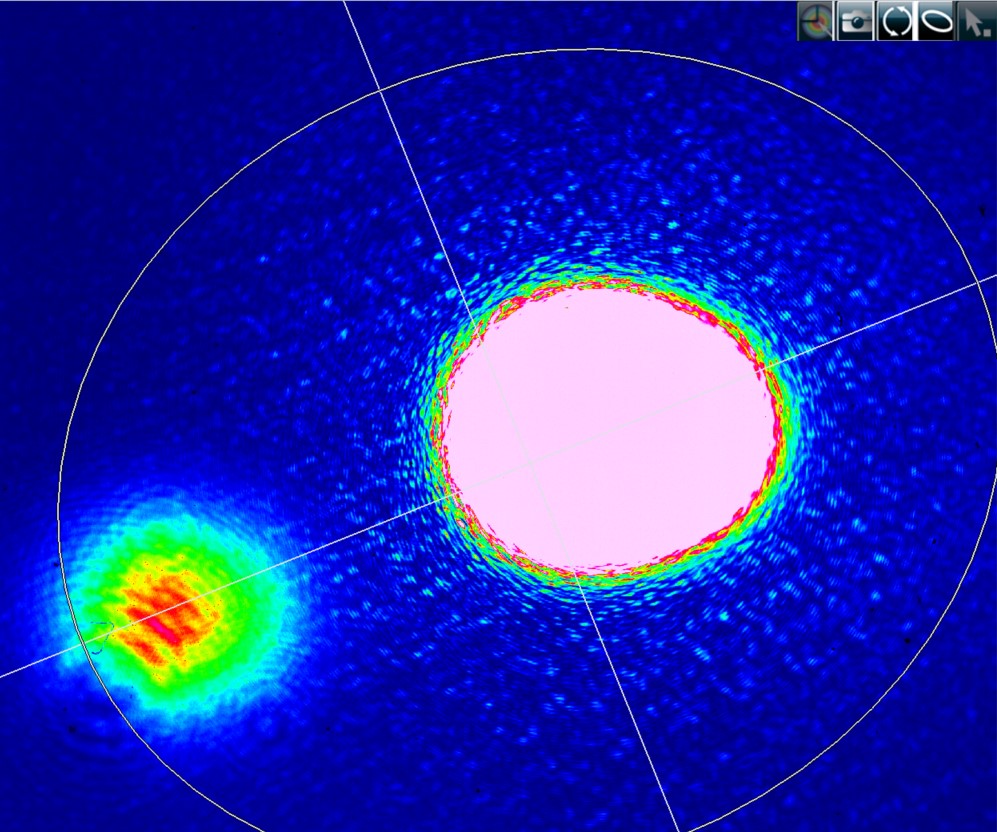
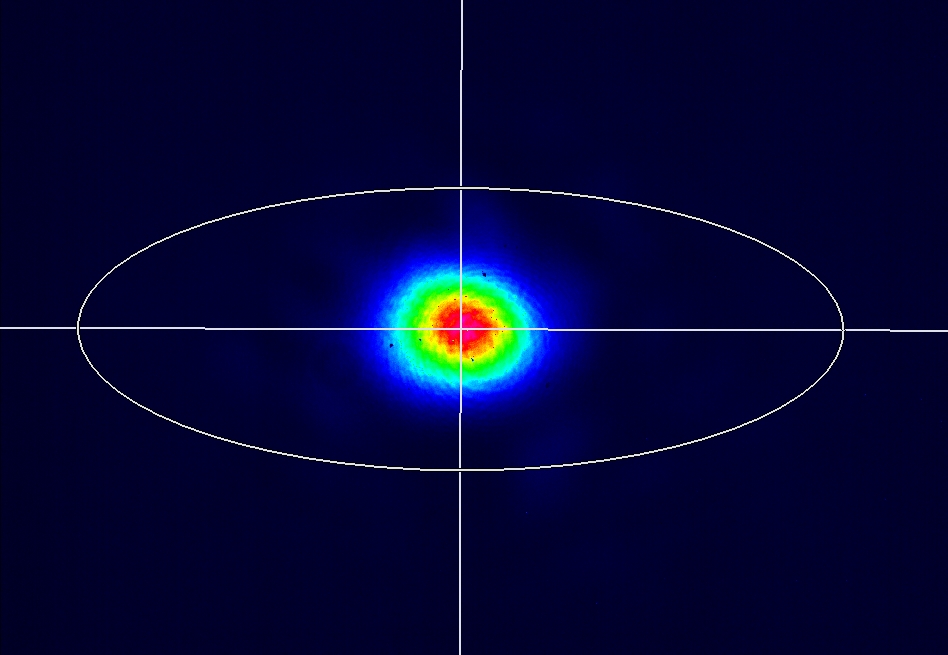
in addition, we have locked at the reflection from the cavity to confirm the spot next to the beam.
We took two images when the laser was locked with the cavity and when it was not.
We clearly see that the spot is indeed related to the mode of the cavity. And probably the damaged spot.
(Difference is size on the reflection image is due to the distance is larger than the transmission + the spherical mirror effect is not there)
| Manar Amer wrote: |
|
To compare between the 2 images of the cavity mode:
- the mode by itself has an integration time of 0.06 ms, position (x, y) = (1142.969, -53.932) um on the beam profiler
- the mode saturated with the spot next to it almost at max intensity has an integration time of 50 ms, position (-3700, -2000) um
comparing the positions of both spots, they have difference (4842.969, 2053.932) um
------ > total difference on the beam profiler ~ 5.3 mm , the distance from the spherical mirror to the beam profiler is ~ 40 cm
| Manar Amer wrote: |
|
Yesterday , we locked the cavity and we see a sign of a high finesse on the transmission signal, but no measurement of Finesse was done.
we have a coupling of ~ 45%, which is a loss of 20% from the previous coupling of 60%
an estimate done by Ronic MATLAB simulation for the coupling drop where we have 200 pp additional losses and gain of 2.6 k we should get a transmission of 1.1 mW for injected power of ~ 300 mW
which is consistent with the power measured after a 50% beam splitter on transmission we got 0.51 mW (total would be 1.02mW)
in addition, there is a beam that is next to the mode of the cavity , confirmed it was not a reflection from the beam splitter or the optics.
it could be that we are still close to the damaged spot ?
| Manar Amer wrote: |
|
ThomX injection mirror has been cleaned and placed again inside the optical cavity.
This time to avoid the damaged spot I have displaced the mirror mount horizontally to have a distance between center of the beam and the spot ~ 2.5 - 3 mm.
The alignment was affected slightly but recovered by adjusting the mirror mount nobs, (00 mode observed in air)
The cavity was closed is being pumped with vacuum.
To be done: adjust the cavity length and find the resonance, improve the outer alignment, lock the cavity
| Manar Amer wrote: |
|
a better image of the damaged spot, image taken with the arrow for the reflective surface facing the other direction (image shows position)
The image of M1 for ThomX reflective surface was taken at min zoom (full image scale 13 mm) and max zoom (full image scale 2 mm) on microscope
The spot appears to be not close to the center of the mirror, at max zoom in the center we do not see the spot it is just out of the image
the last image has the mirror position adjusted to center the damaged spot for a better image of it.
| Manar Amer wrote: |
|
After discussing, we have decided against shifting the mirror to avoid the time lost.
We changed the injection mirror to a different mirror from Mighty Laser set, Transmission of mirror 80 ppm. (no visible damage at the center of the mirror, only a small scratch on the back)
mirror cleaned using pure ethanol and pure water with spin coater, also the spherical mirror was cleaned again.
| Manar Amer wrote: |
|
Tomorrow will try to shift the injection mirror to avoid hitting the damaged spot.
| Manar Amer wrote: |
|
Following the storage of ~ 50 kW inside the cavity and a sudden drop in transmitted power from the cavity
damage to the mirror surface was suspected.
We broke vacuum and took images of the surface of the 2 mirrors in the cavity, the spherical and the planar mirror
image 1 , spherical reflective surface (no visible damage with the UV light, and no visible damage under the microscope)
image 2 , planar coupler mirror reflective surface (no visible damage under UV light, but under the microscope there is a damaged spot close to the center)
image 4 is the planar surface reflective surface at zoom 8 on the microscope.
|
|
|
|
|
|
|
|
| Attachment 1: 00mode_damaged_0_26ms.jpg
|  |
| Attachment 2: 00mode_damaged_saturted_50ms.jpg
|  |
| Attachment 3: reflection_noLock.jpg
|  |
| Attachment 4: reflection_Lock_0_15ms.jpg
|  |
|
171
|
Tue Sep 27 19:30:49 2022 |
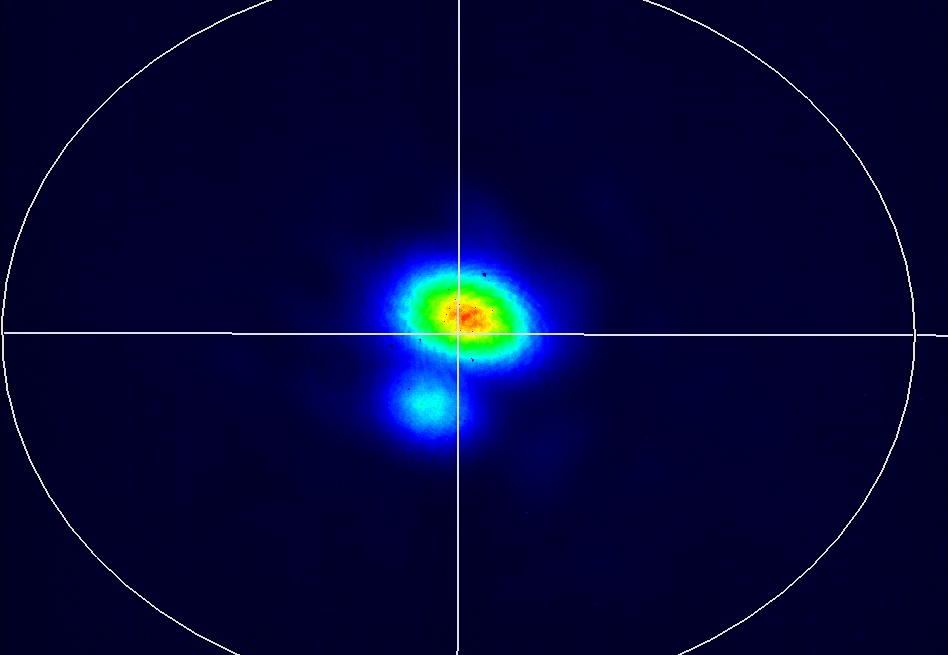
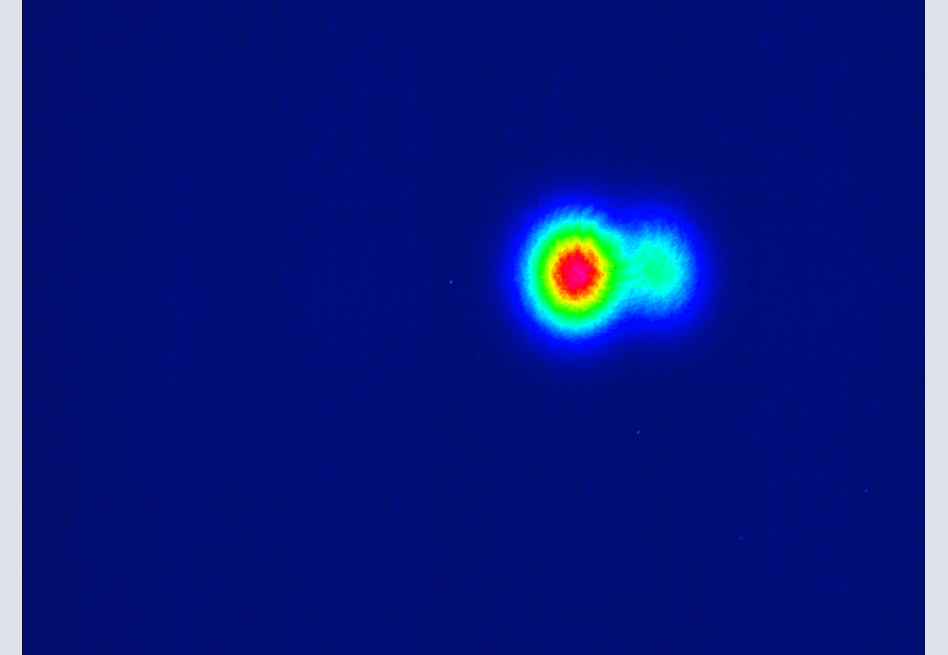
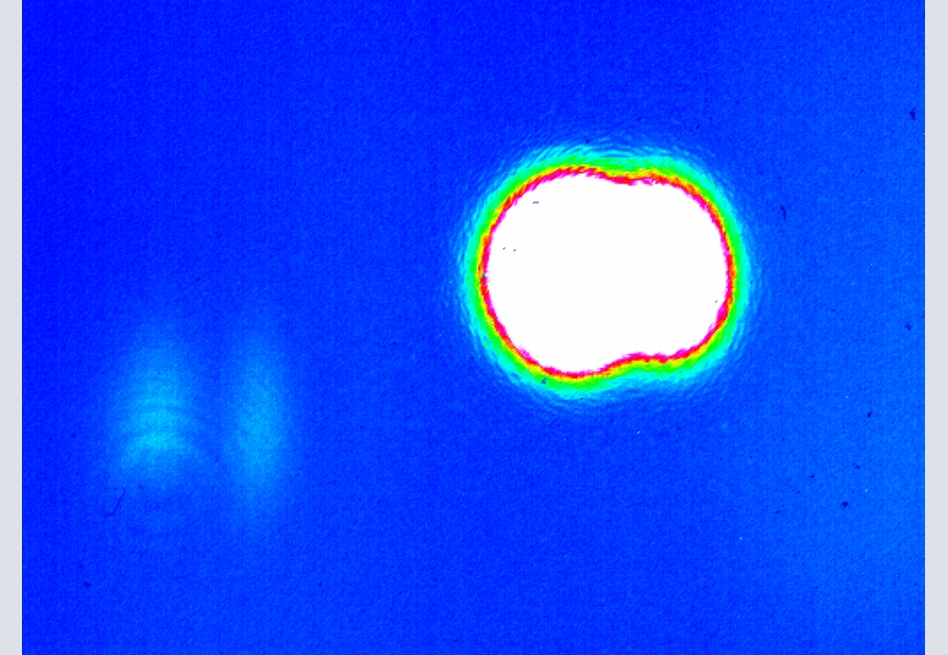
Manar Amer | Fixed | report | lasers and optics | Optical room | M1 Gamma Factory | In the morning, Vacuum broken and rotated M1 ThomX 90 degrees clockwise, locked the cavity in air and we observe a degeneracy close to the fundamental mode.
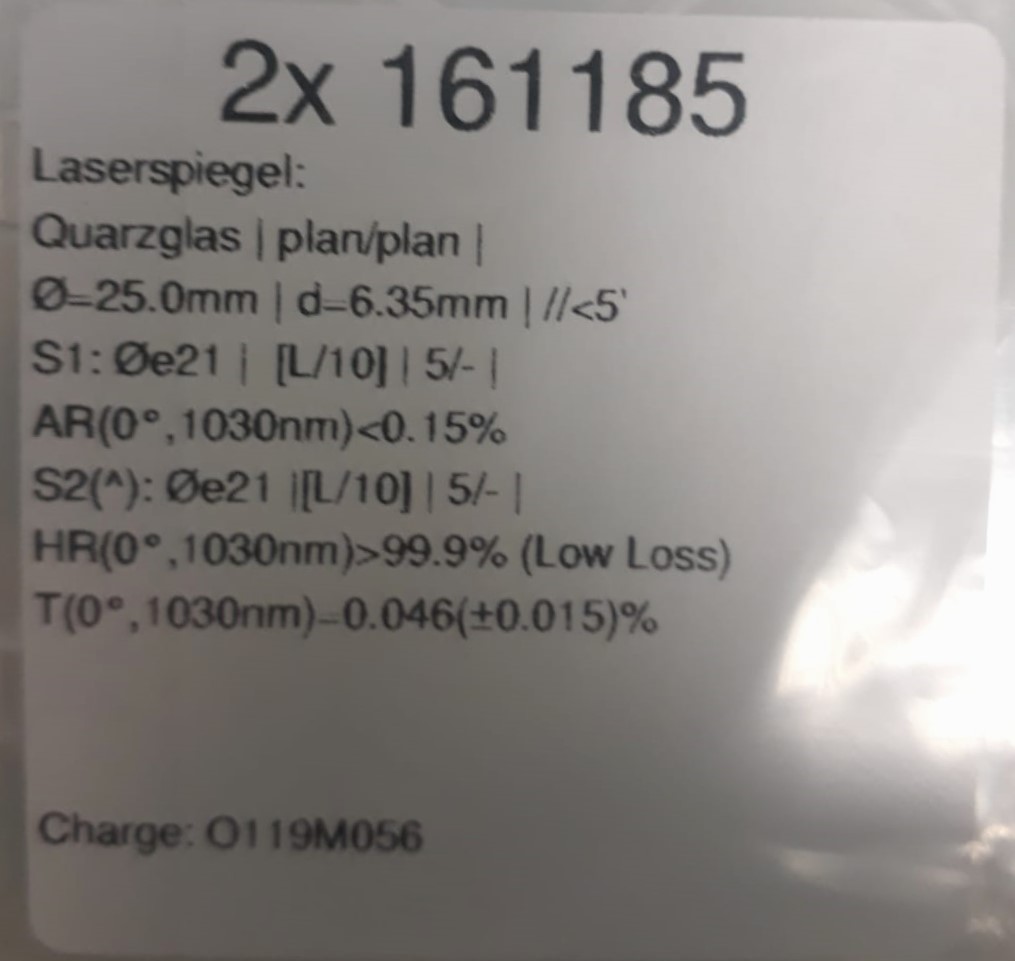
In the afternoon, I cleaned M1 from Gamma factory using pure ethanol and pure water with the spincoater
then placed it as the coupling mirror, aligned and locked in air. we observed similar degeneracy to before next to the fundamental mode.
During the process, M2 spherical from ThomX installed in the cavity was not changed. There could be damage on it, will investigate tomorrow.
| Manar Amer wrote: |
|
On Wednesday 21st , I opened the cavity did an additional 2 mm shift of the injection mirror and put it under vacuum again.
Locked the cavity, and observed the transmitted beam.
The second spot is still visible on the beam profiler , the distance difference between the 2 spots is ~ 5.2 mm (the same as before )
no difference in distance, decreases the likelihood that it is from the damage (to be investigated more)
in addition, we have locked at the reflection from the cavity to confirm the spot next to the beam.
We took two images when the laser was locked with the cavity and when it was not.
We clearly see that the spot is indeed related to the mode of the cavity. And probably the damaged spot.
(Difference is size on the reflection image is due to the distance is larger than the transmission + the spherical mirror effect is not there)
| Manar Amer wrote: |
|
To compare between the 2 images of the cavity mode:
- the mode by itself has an integration time of 0.06 ms, position (x, y) = (1142.969, -53.932) um on the beam profiler
- the mode saturated with the spot next to it almost at max intensity has an integration time of 50 ms, position (-3700, -2000) um
comparing the positions of both spots, they have difference (4842.969, 2053.932) um
------ > total difference on the beam profiler ~ 5.3 mm , the distance from the spherical mirror to the beam profiler is ~ 40 cm
| Manar Amer wrote: |
|
Yesterday , we locked the cavity and we see a sign of a high finesse on the transmission signal, but no measurement of Finesse was done.
we have a coupling of ~ 45%, which is a loss of 20% from the previous coupling of 60%
an estimate done by Ronic MATLAB simulation for the coupling drop where we have 200 pp additional losses and gain of 2.6 k we should get a transmission of 1.1 mW for injected power of ~ 300 mW
which is consistent with the power measured after a 50% beam splitter on transmission we got 0.51 mW (total would be 1.02mW)
in addition, there is a beam that is next to the mode of the cavity , confirmed it was not a reflection from the beam splitter or the optics.
it could be that we are still close to the damaged spot ?
| Manar Amer wrote: |
|
ThomX injection mirror has been cleaned and placed again inside the optical cavity.
This time to avoid the damaged spot I have displaced the mirror mount horizontally to have a distance between center of the beam and the spot ~ 2.5 - 3 mm.
The alignment was affected slightly but recovered by adjusting the mirror mount nobs, (00 mode observed in air)
The cavity was closed is being pumped with vacuum.
To be done: adjust the cavity length and find the resonance, improve the outer alignment, lock the cavity
| Manar Amer wrote: |
|
a better image of the damaged spot, image taken with the arrow for the reflective surface facing the other direction (image shows position)
The image of M1 for ThomX reflective surface was taken at min zoom (full image scale 13 mm) and max zoom (full image scale 2 mm) on microscope
The spot appears to be not close to the center of the mirror, at max zoom in the center we do not see the spot it is just out of the image
the last image has the mirror position adjusted to center the damaged spot for a better image of it.
| Manar Amer wrote: |
|
After discussing, we have decided against shifting the mirror to avoid the time lost.
We changed the injection mirror to a different mirror from Mighty Laser set, Transmission of mirror 80 ppm. (no visible damage at the center of the mirror, only a small scratch on the back)
mirror cleaned using pure ethanol and pure water with spin coater, also the spherical mirror was cleaned again.
| Manar Amer wrote: |
|
Tomorrow will try to shift the injection mirror to avoid hitting the damaged spot.
| Manar Amer wrote: |
|
Following the storage of ~ 50 kW inside the cavity and a sudden drop in transmitted power from the cavity
damage to the mirror surface was suspected.
We broke vacuum and took images of the surface of the 2 mirrors in the cavity, the spherical and the planar mirror
image 1 , spherical reflective surface (no visible damage with the UV light, and no visible damage under the microscope)
image 2 , planar coupler mirror reflective surface (no visible damage under UV light, but under the microscope there is a damaged spot close to the center)
image 4 is the planar surface reflective surface at zoom 8 on the microscope.
|
|
|
|
|
|
|
|
|
| Attachment 1: 00mode_ThomX_Mirror_degeneracySpot_1point04ms.jpg
|  |
| Attachment 2: 00mode_ThomX_Mirror_degeneracySpot_saturateat50.jpg
|  |
| Attachment 3: Coupling_mirror_.jpeg
|  |
|