| ID |
Date |
Author |
Status |
Type |
Category |
Location |
Title |
|
206
|
Thu Mar 28 19:03:55 2024 |
Xinyi Lu | Fixed | info | lasers and optics | Optical room | Amplifier power and mirror transmission |
Today, Ronic, Daniele, Aurélien and I measured the amplifier power and mirror transmission.
| Current (A) |
0 (2rd stage) |
1 |
2 |
3 |
4 |
5 |
6 |
7 |
7.5 |
8 |
| Power (W) |
1 |
1.8 |
11.8 |
23.5 |
35.5 |
47 |
57.5 |
66.9 |
70.7 |
74.9 |
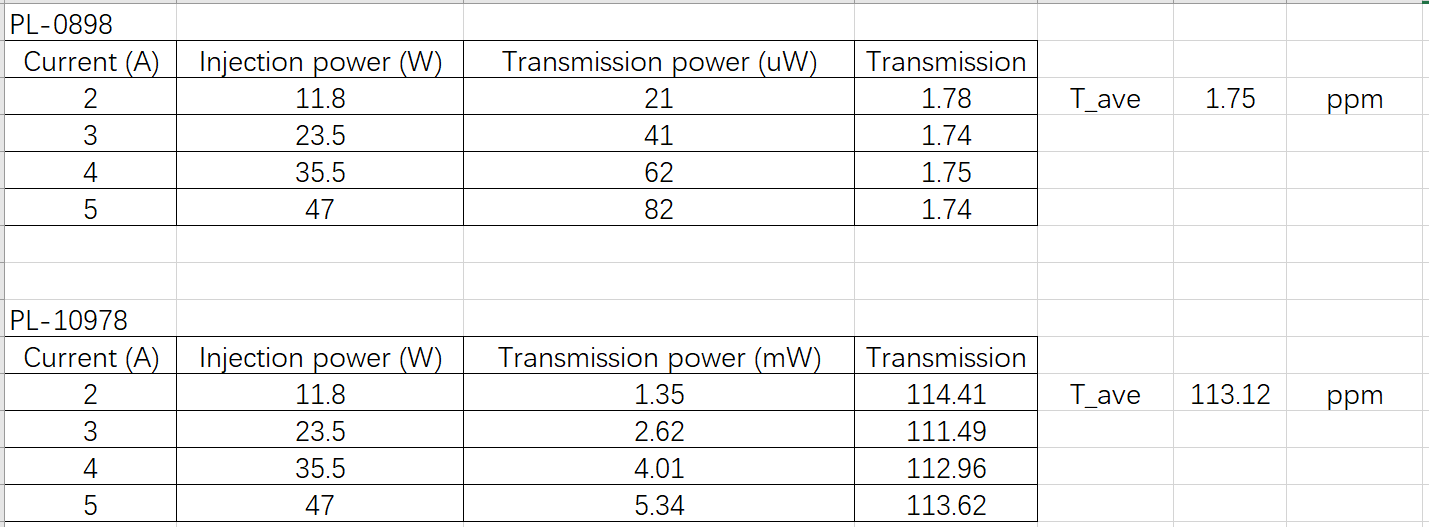
For transmission measurements, we used the same new mirrors as Sbox and ThomX, and installed an iris and a 2-inch mount to block the scattering laser.
The angle of incidence during the measurement was about 0.5°. We changed the angle and the measurements remained the same.
| Mirror Number |
PL-0898 |
PL-10978 |
| Nominal Value |
3 ppm |
115 ppm |
| Measured Value |
1.75 ppm |
113 ppm |
If the mirror being used also has a transmission of 1.75 ppm, the original 270kW is actually 463kW!!! The gain is 6549 and the finesse is 28585 (70% coupling).
We will do more tests to check it.
- Redo the experiment and check the spot behind the window at high power.
- Move the power meter to the plane mirror M2 window. It was previously behind the curved mirror M4 window.
- Compare locking curves, cavity mode sizes, and coupling efficiency at different powers.
- After finishing the high-power experiments, we will measure the finesse using CW laser and the transmission of the mirrors used.
| Xinyi Lu wrote: |
|
Today, Ronic and I achieved 272kW inside the cavity at 7.5A. The coupling maintained 60%-70%.
| Amp current (A) |
Injection power (W) |
Circulating power (kW) |
Gain |
| 2 |
10 |
50 |
5000 |
| 3 |
22 |
105 |
4773 |
| 4 |
34 |
156 |
4588 |
| 5 |
47 |
210 |
4468 |
| 6 |
58(Estimated) |
250 |
4310 |
| 7.5 |
76(Estimated) |
272 |
3579 |
- Compared to yesterday's experiment, we moved the position of the D-shaped mirrors farther in two directions to make the higher-order modes just disappear.
- Possible reasons for higher gain: D-shaped mirrors position, high power and pump vacuum cleaned cavity mirrors so that improve the finesse.
- We didn't see the strange drops like yesterday (Figure 1). However, in the window behind the M3, we can see 3 spots correlating with the intracavity power, even though moving the D-shaped very far does not make them disappear, only weakens them. We don't know where they came from. When this round of experiments is over, we can open the cavity and observe the optical paths.
- Next steps:
- Repeat the experiment to ensure that the gain does not drop.
- Long-term measurement at maximum power when the amplifier temperature is safe.
- Measure the transmittance of the cavity mirrors and the amplifier power.
- Open the cavity and observe the optical paths and the mirror surface.
| Xinyi Lu wrote: |
|
all the injection power in the chart have not been measured recently but during the Loic thesis period.
and these old measurements stopped at 5.5A of pump current.... so, the data at "8A" is a pure estimation.
about the last measurement :
it was made at 6A/8A/8A/8A for the 4 pump diodes of the amplifier (because 1st stage has a Peltier issue and we cannot check its temperature), so the average current is 7.5A instead of 8A.
and the linear scale between pump current and amplifier power is ~ 12W/A, then the estimated amplifier power for the last measurement is 76W instead of 87W
and the estimated gain is more 2658.
for this current, the amplifier works out of its nominal limits (temperature set at 25°C but measured at 30°C !!!) and the fans of the crate are making noise like hell.
so the last gain estimation should be treated very cautiously.
about the transmission and reflection signals behavior, one can write :
R + T + L = 1 => energy conservation for the cavity.
dR + dT + dL = 0 => dL = - (dR + dT)
if dX = Xfinal - Xinitial, dR and dT are < 0 on the last picture, then dL > 0.
it means that this picture seems to show that some losses are increasing from the beginning of the locking process.
several possibilities :
- we saw a strange D-shape effect on the large port of the cavity.
it seems that one of the D-shape mount/mirror is touching the intra-cavity beam producing some ghost effect on this large cavity port.
some cavity axis changing during the beginning of the lock could introduce some additionnal losses.
it can be easily tested by puting the D-shapes far from the beam.
- because of cavity axis changing at the beginning of the lock, the mirror losses are different.
but it is surprising that it is still going in the same direction... more losses at the end.
could be tested by slightly changing the optical axis of the cavity.
- "prior damage" behavior with a bump in the middle of the mirror due to thermal effect which introduces some losses at the end.
=> if it's the case, it's not a good behavior !!! :-(((
can be tested by looking at the wavefront phase in transmission.
- Non linear effect is the coatings.
but the field density seems not so much to produce this kind of effect
- A thermally induced change in the refractive index of the mirrors.
Daniele mentionned a relation between real and imaginary (related to absorption) parts of this refractive index which could explain that a reflectivity change could induce an absorption change.
| Xinyi Lu wrote: |
|
These days, Ronic and I achieved 200kW inside the cavity and 70% coupling efficiency.
- By optimizing the telescope, the coupling reached 70% with iris fully open and maintained 60%-70% coupling at high power.
- The cavity mode went from 2.2mm,2.5mm (38kW) to finally 2.3mm,2.8mm (200kW) without changing a lot.
- Gradually raising the power while optimizing alignment, CEP, and locking, we got the following stable power:
| Amp current (A) |
Injection power (W) |
Circulating power (kW) |
Gain |
| 2 |
10 |
38 |
3800 |
| 2.3 |
14 |
50 |
3571 |
| 3 |
22 |
70 |
3181 |
| 4 |
35 |
115 |
3285 |
| 5 |
48 |
158 |
3292 |
| 8 |
87(Estimated) |
202 |
2322 |
- Next steps:
- Explain the strange drop phenomenon that occurs at high power, where both transmission and reflection drop, as in Fig. 2.
- Maintains a half-hour locking at 200kW. Now the temperature of the amplifier at 8A is over 40 degrees, which may be risky.
|
|
|
|
| Attachment 1: 3rd_amp_power.png
|
 |
| Attachment 2: Transmission_measurement.png
|
 |
|
132
|
Fri Aug 19 16:31:11 2022 |
Manar Amer | Fixed | report | lasers and optics | Optical room | Amplifier output Beam Profile |
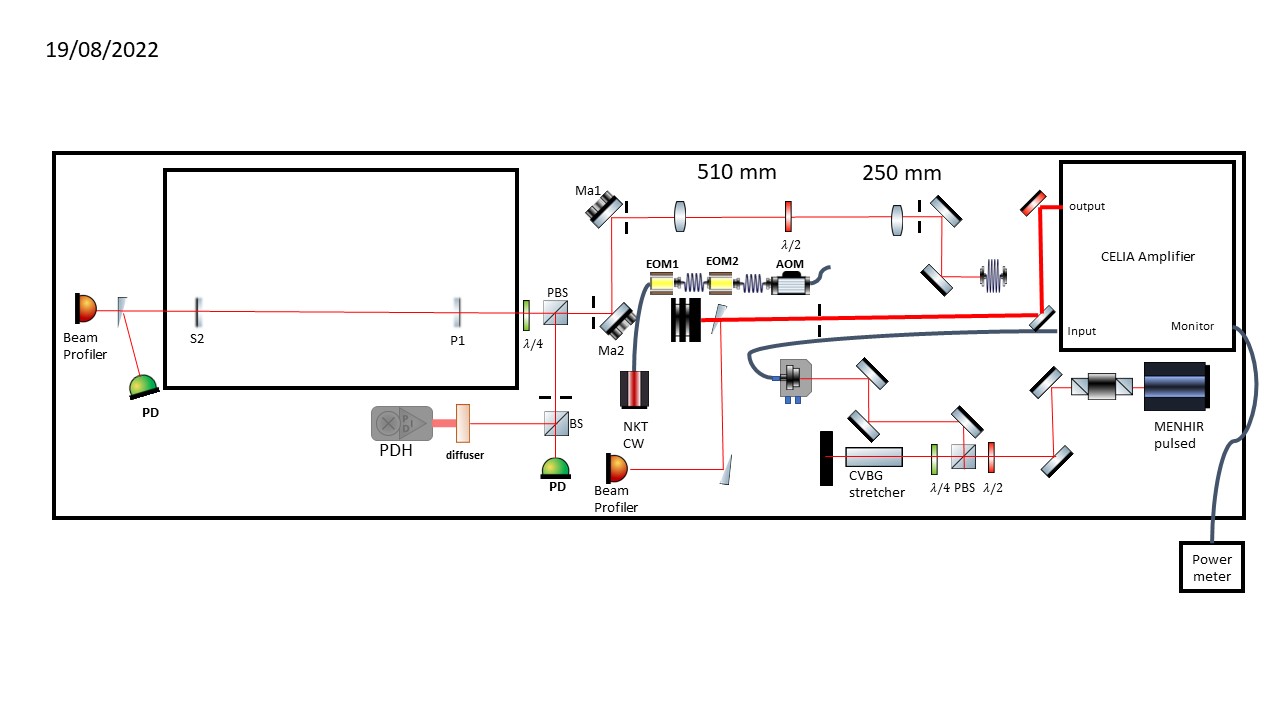
In preparation to measure the output beam profile from the amplifier at high power, I have placed two wedge mirrors just before the beam dump to be able to extract the beam.
One of the wedges was taken from ThomX bunker, also the HR and AR mirrors were taken to plic room in case we might need them
an updated setup is attached |
| Attachment 1: 20220819_Setup.jpg
|
 |
|
135
|
Mon Aug 22 18:39:13 2022 |
Manar Amer | Fixed | report | lasers and optics | Optical room | Amplifier output Beam Profile |
Beam divergence after amplifier 4.46 mrad
| Manar Amer wrote: |
|
In preparation to measure the output beam profile from the amplifier at high power, I have placed two wedge mirrors just before the beam dump to be able to extract the beam.
One of the wedges was taken from ThomX bunker, also the HR and AR mirrors were taken to plic room in case we might need them
an updated setup is attached
|
|
|
194
|
Tue Feb 27 17:51:56 2024 |
Xinyi Lu | Fixed | info | lasers and optics | Optical room | Amplified laser injection |
In the last two days, Ronic and I connected the amplifier and locked the cavity.
- We installed an iris on the output to remove a part of the pump.
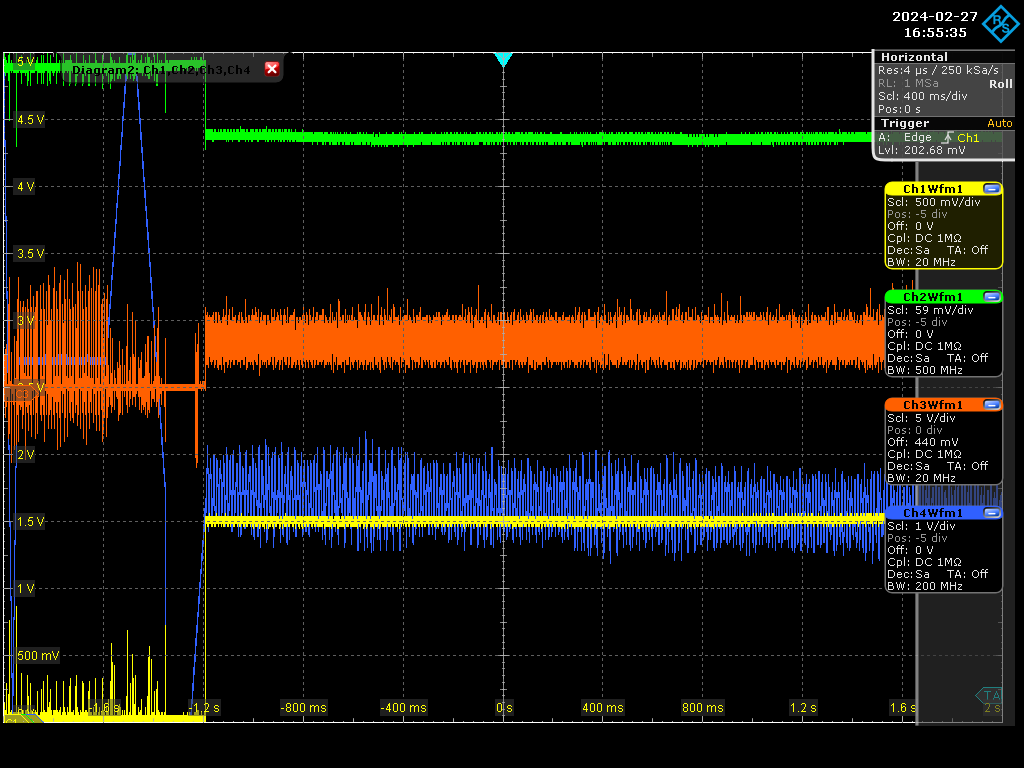
- We turned on the second stage of the amplifier. When locking, the injected power is 220 mW and the transmitted power after M2 is 26 uW.
- Low gain and coupling efficiency due to bad mode matching and CEP.
Next steps:
- Turn on the third stage of the amplifier, measure the beam parameters, and adjust the telescope.
- Check the adjustment range of AOM frequency that enables the amplifier to operate safely.
- Measure consecutive fundamental mode resonances to determine the direction of AOM frequency tuning. |
| Attachment 1: Screenshot_2024-02-27_1_165535.png
|
 |
|
232
|
Tue Mar 4 18:51:57 2025 |
Ronic Chiche | Under Process | info | mechanics | lasers and optics | Optical room | Alignment of a 2-mirror FP cavity |
today with Alice,
- we measured the height of the SBOX windows center : 140mm from the optical table.
- we set the laser fiber colimator exactly at this height.
- we placed 2 mirrors to align the future telescope path at exactly 140mm height along the whole possible travel of the lenses in order to keep them aligned.
the horizontal position is also aligned on this path and a ruler has been placed along this path to help to move the future telescope lenses without misalignment.
- we aligned 2 iris on this path to keep this path axis in case of misalignment.
- we placed 2 iris at the center of the input and output FP-cavity windows.
- we precisely aligned the laser beam on these iris.
in the next days, we need to align the mounts in the SBOX and align also the 2 FP-cavity mirrors.
the output mirror will be a "bad" ThomX 2.24m ROC ULE mirror and the input mirror will be a plan 460ppm Gamma Factory mirror. |
|
118
|
Fri Jul 22 18:00:21 2022 |
Manar Amer | Fixed | report | lasers and optics | detectors and electronics | software | Optical room | Alignment / Table setup |
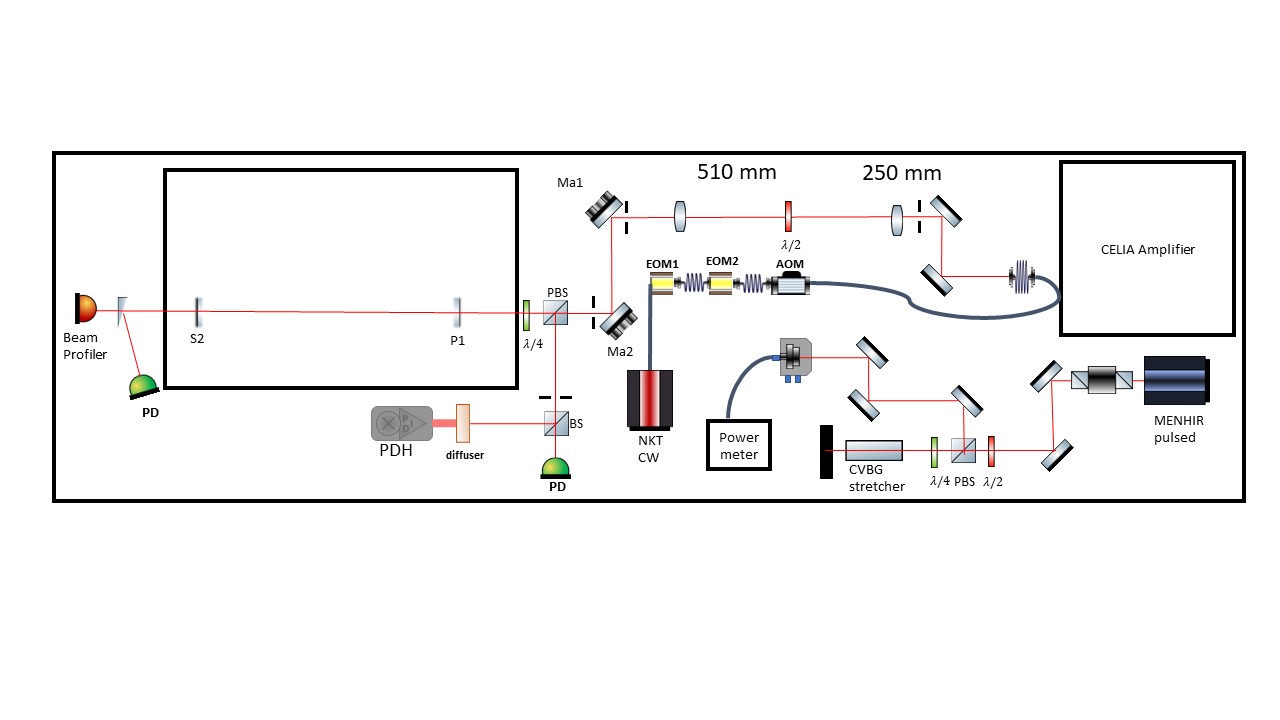
The current setup of the optical table attached.
The cavity is aligned and the lock of the fundamental mode has been attempted, but the mode is drifting too quickly to be able to follow.
I have placed the cavity under vacuum for a better stability.
a simple telescope for the CW was adjusted to having 2 lenses of 300 mm placed ~ 250 mm away from the colimator and 200 mm lens placed after it with 510 mm.
|
| Attachment 1: 20220722_table_setup.jpg
|
 |
| Attachment 2: 20220722_tablesetup.jpg
|
 |
|
130
|
Fri Aug 19 16:03:17 2022 |
Manar Amer | Fixed | report | lasers and optics | detectors and electronics | software | Optical room | Alignment / Table setup |
closing series
| Manar Amer wrote: |
|
The current setup of the optical table attached.
The cavity is aligned and the lock of the fundamental mode has been attempted, but the mode is drifting too quickly to be able to follow.
I have placed the cavity under vacuum for a better stability.
a simple telescope for the CW was adjusted to having 2 lenses of 300 mm placed ~ 250 mm away from the colimator and 200 mm lens placed after it with 510 mm.
|
|
|
29
|
Wed Nov 13 13:15:53 2019 |
Loïc Amoudry | Fixed | report | lasers and optics | Other | AFM+ InfraRed spectroscopy (IR spectro) has been performed |
AFM+ InfraRed spectroscopy (IR spectro) has been performed on 400kW S-BOX mirrors.
Seems that XPS made M3 and M4 dirty, but M1 have also ome dust. M2 seems clean, further AFM experiment should show that it is as clean as M1. |
| Attachment 1: 191113_AFMetspecIR-miroirs_SBOX.pdf
|
|
27
|
Fri Feb 1 13:45:19 2019 |
Loïc Amoudry | Fixed | report | lasers and optics | Other | AFM performed on S-BOX mirrors |
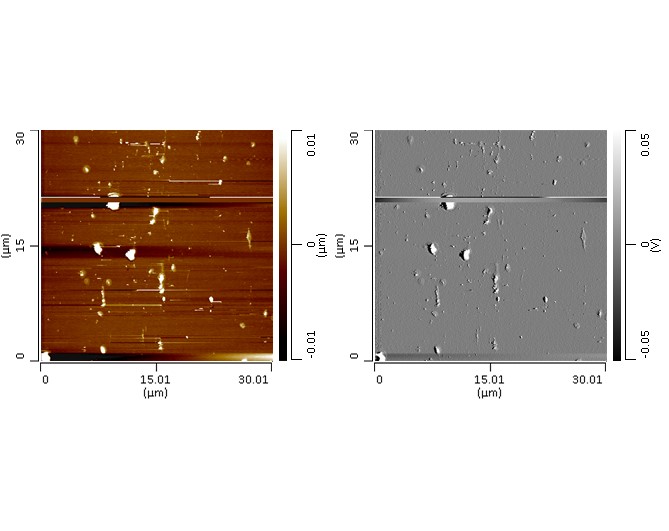
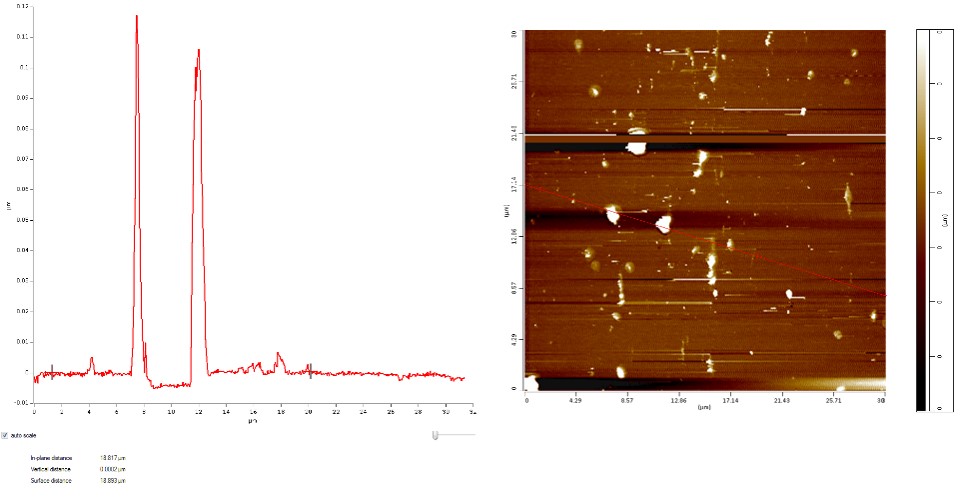
29/02/19 - AFM has shown that spots on mirror's surfaces are bumps and not holes. |
| Attachment 1: Image3.jpg
|
 |
| Attachment 2: Image4.jpg
|
 |
|
50
|
Fri Jan 24 17:56:11 2020 |
Loïc Amoudry | Fixed | info | lasers and optics | Optical room | AFM analysis of M2 |
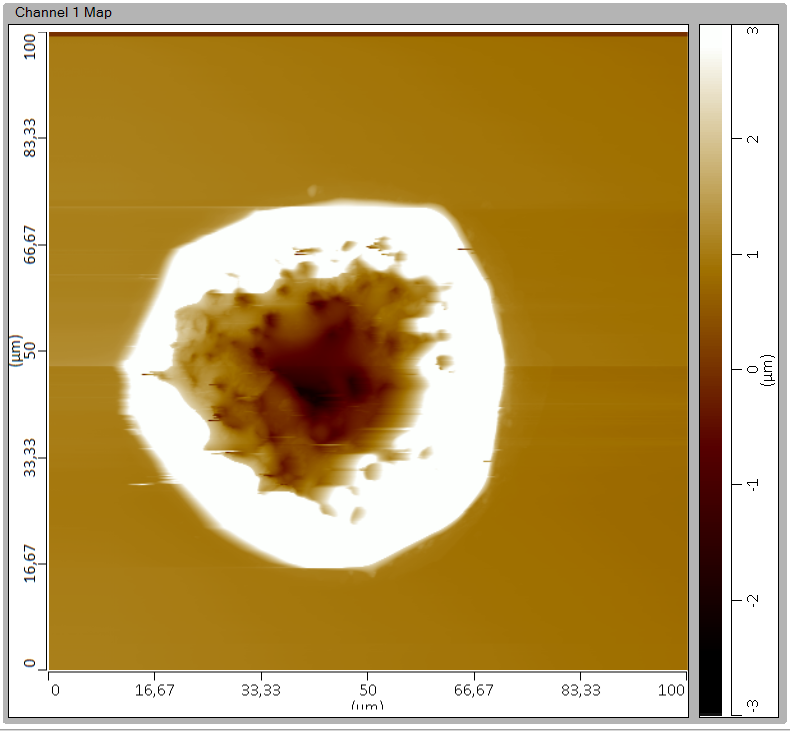
We had enough time to proceed a quick scan of M2 which has also a hole but not centered on the mirror.
The hole is larger and higher than the one on M1. But the vertical range was to high for the AFM. Then we cannot see if there are sparkles or not on this image. Further study with microscope would be welcome. |
| Attachment 1: M2.PNG
|
 |
|
49
|
Fri Jan 24 17:52:14 2020 |
Loïc Amoudry | Fixed | report | lasers and optics | Optical room | AFM analysis of M1 |
AFM has been proceeded on M1 and M2.
The pdf shows the first images taken with the PLIC room Leica microscope (zoom x10 and x80).
Then the hole has been studied with a handmade microscope. It brought a better resolution. We can now see the hole has an edge, a center structure and and extra-hole sparkle (pailleté) structure.
The AFM shows these 3 structures are real. The top of the hole is at ~+1µm and the center ~-2µm compare to the coating surface. The sparkles are ~10nm high and we also found kind of "explosion" desposit while zooming on the sparkles.
The 3D view and profil show perfectly the "crater". |
| Attachment 1: 200115_AFM_miroirs.pdf
|
|
33
|
Wed Dec 11 17:13:02 2019 |
Ronic Chiche | Fixed | issue | lasers and optics | Optical room | 2nd stage amplifier issue |
the 2nd stage amplifier needed several hours (4-5h) to reach its nominal power (we look at photodiode level on a scope), instead of the awaited 30 minutes.
could it come from the probable spectrum shifting of the OneFive laser ?
(the power coming from the CVBG, coupled to the fiber, is lower than expected). |
|
34
|
Thu Dec 12 11:49:05 2019 |
Ronic Chiche | Fixed | issue | lasers and optics | Optical room | 2nd stage amplifier issue |
Last time, we switched ON directly the 2nd stage at 6A without increasing/decrinsing slowly the current.
today, we switched ON the chiller, switched ON the 1st stage, switch ON the power supply of the 2nd stage at 0A and then we increased slowly the current until 6A... and the problem disappeared.
| ARonic Chiche wrote: |
|
the 2nd stage amplifier needed several hours (4-5h) to reach its nominal power (we look at photodiode level on a scope), instead of the awaited 30 minutes.
could it come from the probable spectrum shifting of the OneFive laser ?
(the power coming from the CVBG, coupled to the fiber, is lower than expected).
|
|
|
35
|
Fri Dec 13 15:56:22 2019 |
Ronic Chiche | Fixed | issue | lasers and optics | Optical room | 2nd stage amplifier issue |
2nd stage output power was going down. We checked the pump diode technical data sheet and the operating temperature is [25°C:35°C].
We increased the chiller temperature setpoint from 19°C to 23°C.
Then the output power increased (93mW on 2nd stage photodiode).
| Ronic Chiche wrote: |
|
Last time, we switched ON directly the 2nd stage at 6A without increasing/decrinsing slowly the current.
today, we switched ON the chiller, switched ON the 1st stage, switch ON the power supply of the 2nd stage at 0A and then we increased slowly the current until 6A... and the problem disappeared.
| ARonic Chiche wrote: |
|
the 2nd stage amplifier needed several hours (4-5h) to reach its nominal power (we look at photodiode level on a scope), instead of the awaited 30 minutes.
could it come from the probable spectrum shifting of the OneFive laser ?
(the power coming from the CVBG, coupled to the fiber, is lower than expected).
|
|
|
|
139
|
Tue Aug 30 17:48:39 2022 |
Ronic Chiche | Fixed | info | lasers and optics | Optical room | 2nd stage CELIA amplifier |
today, we measured the 2nd stage CELIA amplifier pump wavelength : 970-990 nm |
| Attachment 1: 2nd_stage_pump_wavelength.jpg
|
 |
|
140
|
Wed Aug 31 18:14:51 2022 |
Ronic Chiche | Fixed | info | lasers and optics | Optical room | 2nd stage CELIA amplifier |
today we did several test with the Dichroic shortpass mirror (Thorlabs DMSP1000) and with a 10nm optical filter around 1030nm (which works in tranmission at AOI=0).
one used the dichroic mirror in reflection: one should cut the pump @970-990nm and we should keep only the signal @1030nm.
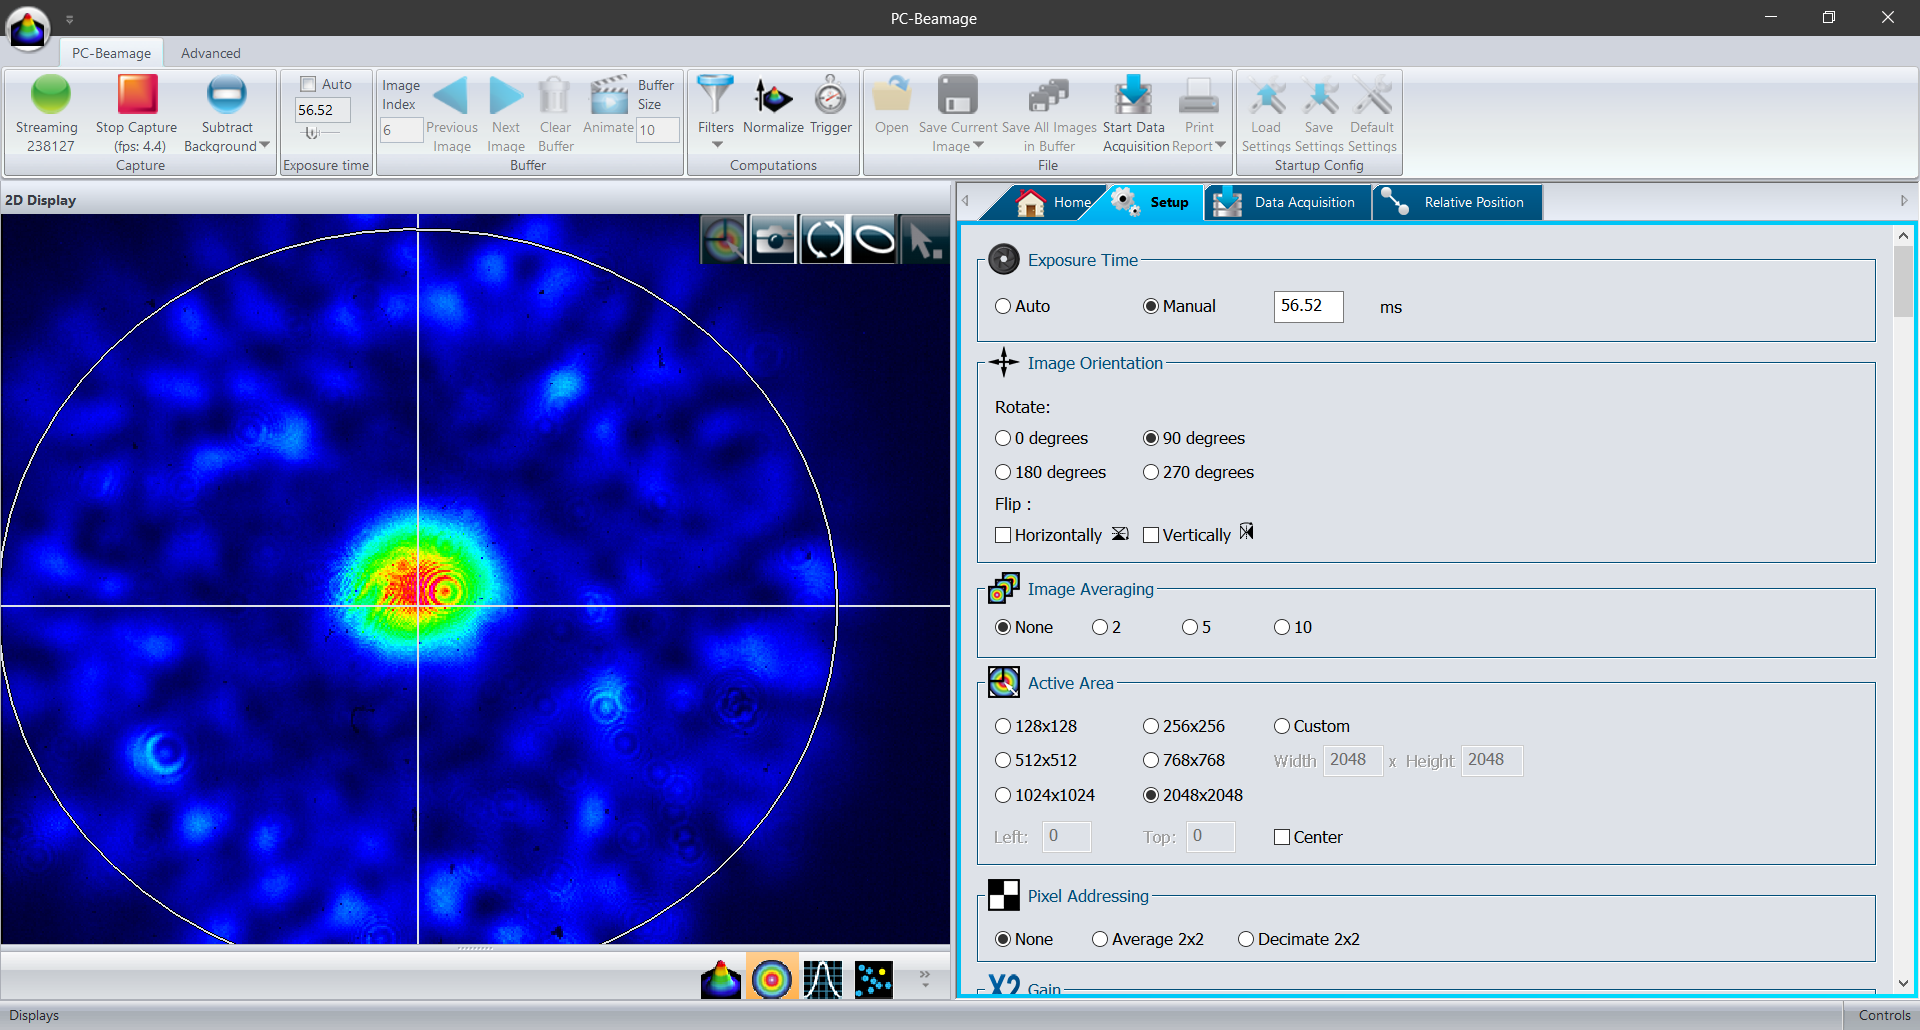
but we still saw plenty spots around the central beam (see the image).
adding the 10nm optical filter on the camera, the image did not change !
then we confirmed the whole signal (centered beam + spots) are well @1030nm.
this spots could be the remaining high order modes of the large fiber used for the 3rd stage of the amplifier.
| Ronic Chiche wrote: |
|
today, we measured the 2nd stage CELIA amplifier pump wavelength : 970-990 nm
|
|
| Attachment 1: image_faisceau_multimode_@1030nm.PNG
|
 |
|
239
|
Thu Aug 28 15:29:00 2025 |
Alice Renaux | Under Process | report | lasers and optics | Optical room | 2-mirror cavity locking |
In June, we encountered some problems regarding the transmission and error signals (see images here), looking as if the laser was switched off before the cavity was filled.
Aurélien, Ronic and I discussed this on 08/27, resulting in a list of tests to perform. We :
- checked the mirrors' thickness (maybe there was some mechanical stress if they were too thick). The mirrors' thickness is 6.35mm (1/4 inch) and is consistent with the mounts size ;
- checked the mirrors' mounts' screws' tightening (maybe the mirrors were either moving if the screws were not tight enough or some mechanical stress if they were too tight). We tightened the mirrors' mounts' upper screws.
Next thing we did with Ronic was check if the error signal depended on the modulation/demodulation relative phase, which was not the case, but it should have.
Ronic added a quarter waveplate before the half waveplate in the injection system.
Today, on 08/29, the succession of the higher-order transverse modes when scanning the seeder laser's piezoelectric actuator's voltage to scan the seeder laser's optical frequency seemed a bit strange, so we checked the resonance frequencies of several occurrences of the same transverse mode :
- (0, 0) : @ -0.4V and 6.0V ;
- (1, 0) and (0, 1) : @0.5V and 6.9V.
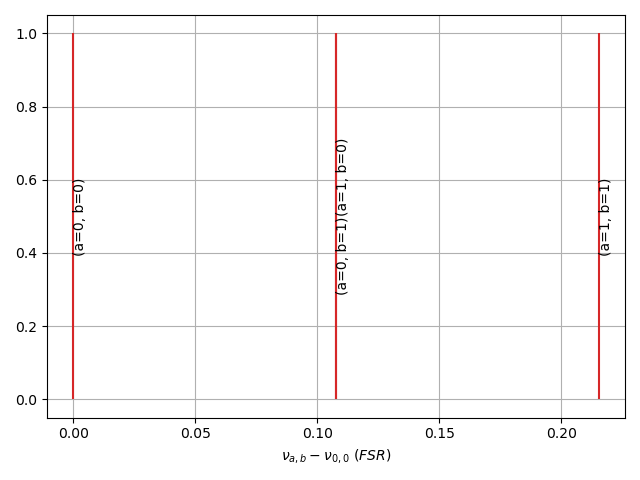
In both cases, several occurrences were separated by about 6.4V, which corresponds to the voltage difference to scan a full FSR. The spacing between (0, 0) and (1, 0)/(0, 1) is then about 0.14*FSR.
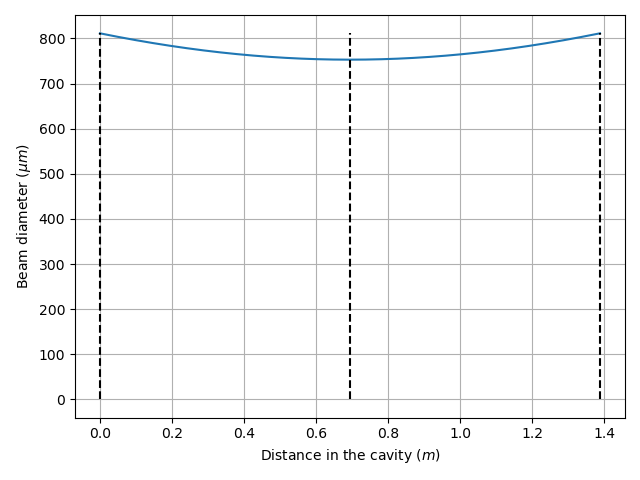
I checked this by writing a small piece of Python code to calculate the cavity's fundamental transverse mode and its Rayleigh length, which is displayed in Figure 1, and then by calculating the resonance frequencies wrt the (0, 0) resonance frequency for the (1, 0), (0, 1) and (1, 1) transverse modes, which is displayed in Figure 2, with the following formula: $\nu_{p, n, m}=(p+\frac{(n+\frac{1}{2})\arctan(\frac{2L_{\text{cav}}}{z_{\text{R}}})+(m+\frac{1}{2})\arctan(\frac{2L_{\text{cav}}}{z_{\text{R}}})}{2\pi})\times\text{FSR}$ for a $p$ longitudinal and ($n$, $m$) transverse mode. Here, $p=1$. The spacing betwen (0, 0) and (1, 0)/(0, 1) is about 0.11*FSR, making the previous observation consistent with the calculation. Everything seems normal.
Ronic also increased the EOM modulation voltage, increasing the modulation depth for the generation of the error signal (from 100mV RMS to 300mV RMS), making the error signal depend on the modulation/demodulation relative phase, as it should. He managed to lock the laser onto the cavity for about 1s at a time.
Next steps are to optimize the PID parameters and to add a low-pass filter/AOM to cut the higher frequencies off and improve the feedback loop. |
| Attachment 1: Figure_1.png
|
 |
| Attachment 2: Figure_2.png
|
 |
|
236
|
Wed May 28 18:27:27 2025 |
Alice Renaux | Under Process | report | lasers and optics | Optical room | 2-mirror cavity full setup |
Today with Ronic, we changed the FP cavity's mirrors to Layertek (Gamma Factory) mirrors :
- M1 : n°161186 --> fused silica, unknown absorption, unknown diffusion, T1=2500ppm transmission planar mirror ;
- M2 : n°161182 --> fused silica, unknown absorption, unknown diffusion, T2=10ppm transmission, 5m ROC mirror.
RTL (round-trip losses) ~ 2500 + 10 ppm (we forget the unknown parameters for absorption and diffusion).
The maximal finesse we could expect is thus F=π([(1-T1)(1-T2)]^(1/4))/(1-[(1-T1)(1-2)]^(1/2)) ~ 2*pi /RTL ≈ 2500 assuming no absorption and no scattering.
The FP cavity's FSR is ≈ 216 MHz given its length.
We managed to see some optical beating on the FP cavity's mirrors and to reach the fundamental transverse mode of the FP cavity by adjusting the injection mirrors, but when scanning the laser's wavelength, some higher-order modes appear and the fundamental mode is reached when the voltage applied to the piezoelectric actuator of the laser's cavity is ≈0V. The actuator is not meant to work with negative voltages, so we translated one of the FP cavity's mirrors so that the fundamental transverse mode's resonance frequency is in the middle of the voltage range.
We also removed the D-shaped mirrors, as they are only useful when working with high power. |
|
233
|
Fri Mar 21 18:27:36 2025 |
Alice Renaux | Under Process | report | mechanics | lasers and optics | Optical room | 2-mirror cavity alignment |
At the beginning of the week, I installed a half-wave plate, a beamsplitter cube and a quarter-wave plate, as well as the end-of-cavity mirror, which I unsuccessfully tried to align.
I removed the end-of-cavity mirror and started the laser injection over again with the two motorized mirrors placed in front of the vacuum chamber (but left Ronic's setup as it was).
Today, I aligned the laser by putting an iris on the cavity mirrors' mounts. I tested the repeatability of such a setup, both by removing and putting back the same iris and by using a different iris. The result is in the attached pictures. Is it good enough ?
The mirrors' motors positions are :
- 1 : 3.349670 mm ;
- 3 : 2.060280 mm ;
- 4 : 3.484560 mm ;
- 5 : 3.269710 mm.
|
| Attachment 1: 2-mirror_cavity_alignment.zip
|
|
234
|
Tue May 27 18:12:22 2025 |
Alice Renaux | Under Process | report | lasers and optics | Optical room | 2-mirror cavity alignment |
Yesterday and today, I replaced the OEWaves CW laser with the NKT CW laser. Its screen does not display anything, so it has to be operated through the GraphiK software.
I then re-aligned the cavity with a new adjustment adaptation tool between the mirror mounts and the irises.
The motor positions are :
- 1 : 3.354420 mm
- 3 : 2.128850 mm
- 4 : 3.468480 mm
- 5 : 3.157300 mm
I then connected the LaseLock module to scan the NKT laser wavelength on a roughly 0-10 V range at a 2Hz rate, so that it could match the cavity's resonance frequency.
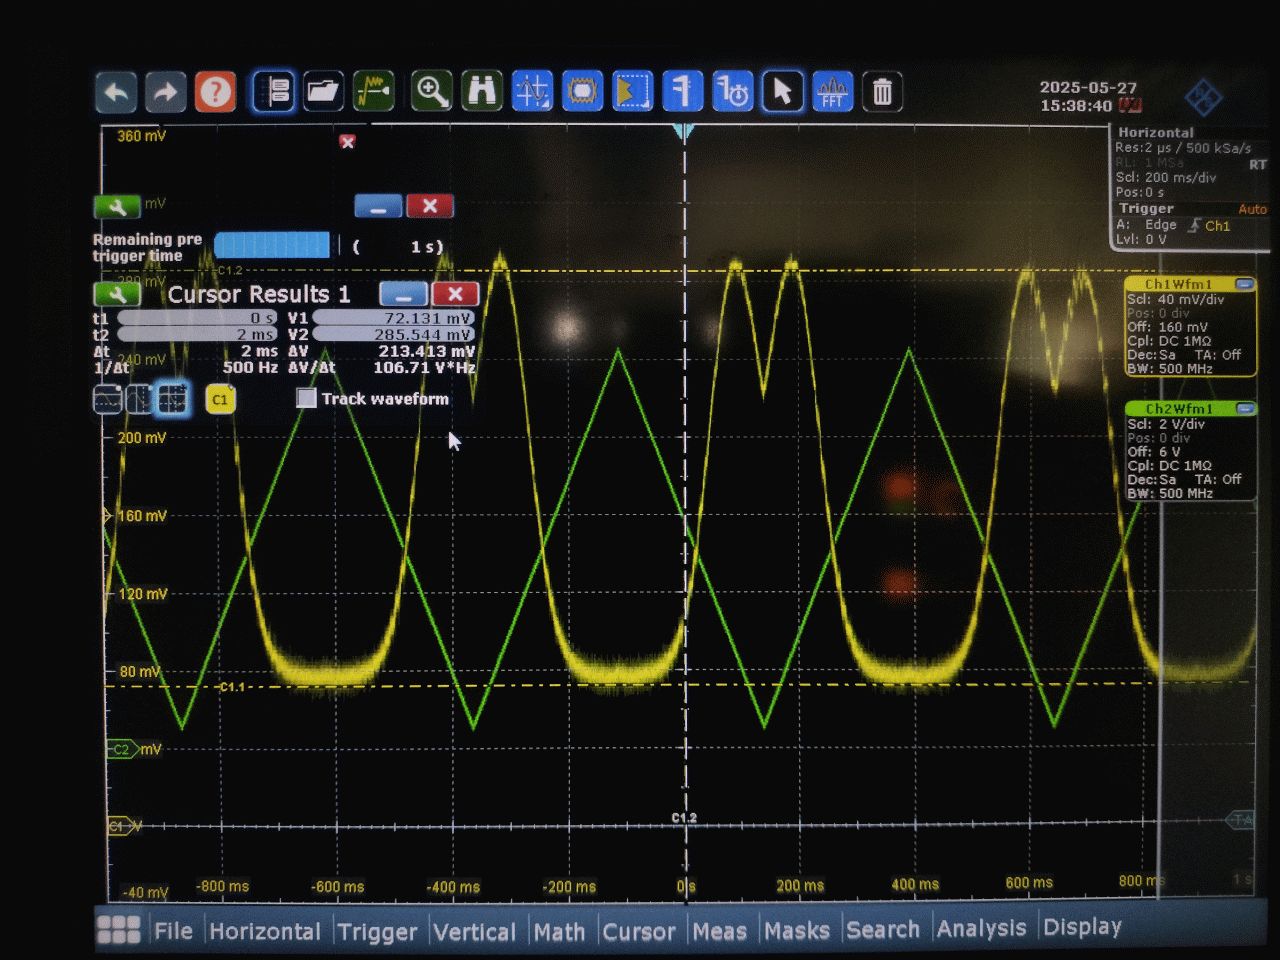
Without optimizing the injection, I monitored the transmitted power with a photodiode paired with an amplifier. The pictures are available through this link : https://box.in2p3.fr/s/TGgwkKgYik7MyqW, and an example picture is attached. Their timestamp is in their filenames, and it seems that the transmission varies quite a lot on a ≈10 s scale, and these variations seem to be periodic on a ≈1 minute scale. The peaks seem weirdly wide, almost up to 100-200 MHz (≈FSR). |
| Attachment 1: IMG20250527160111.jpg
|
 |