| ID |
Date |
Author |
Status |
Type |
Category |
Location |
Title |
|
29
|
Wed Nov 13 13:15:53 2019 |
Loïc Amoudry | Fixed | report | lasers and optics | Other | AFM+ InfraRed spectroscopy (IR spectro) has been performed |
AFM+ InfraRed spectroscopy (IR spectro) has been performed on 400kW S-BOX mirrors.
Seems that XPS made M3 and M4 dirty, but M1 have also ome dust. M2 seems clean, further AFM experiment should show that it is as clean as M1. |
| Attachment 1: 191113_AFMetspecIR-miroirs_SBOX.pdf
|
|
59
|
Mon Jun 24 16:15:08 2019 |
Huan Wang | Fixed | info | lasers and optics | Optical room | amplifier |
I just had a phone call with Jérome and he told me 2 things :
* Be carefull ! the MightyLaser amplifier is not designed to work with 33MHz laser : the streching level is not sufficient !
One could worsen the phase noise by self-modulation due to peak power or even distroy the amplifier !
One should use it only at low power !!!
* He thinks we should more or less find back the same DC levels than before even with lower seeding power and lower repetition rate.
He thinks we should look at the optical spectrum to check if we don't have some ASE in the 1st stage and 2nd stage signal !
We can send him plots or call him to discuss these points.
| Huan Wang wrote: |
|
Onefive output power is 24mW now, and 2.41mW(after EOM) injected into fiber,
a injection power monitor added, 99% (2.06mW) injected into amplifier, 1% (16.1uW) monitored with photodiode DET36A/M, which gives ~500mV DC signal on oscilloscope with 1Mohm impedanc;
First stage amplifier works good, monitoring phtodiode gives more than 200mV DC signal with 50ohm impedance on oscilloscope (as attached photo);
Second stage, the old monitoring photodiode is broken, a new monitoring photodiode is connected, which we don't have reference data for it,
on the optical output port of the monitoring signal, it's written 150mW, but at where we measured 40mW.
|
|
|
58
|
Wed Jun 19 18:54:00 2019 |
Huan Wang | Fixed | info | lasers and optics | Optical room | amplifier |
Onefive output power is 24mW now, and 2.41mW(after EOM) injected into fiber,
a injection power monitor added, 99% (2.06mW) injected into amplifier, 1% (16.1uW) monitored with photodiode DET36A/M, which gives ~500mV DC signal on oscilloscope with 1Mohm impedanc;
First stage amplifier works good, monitoring phtodiode gives more than 200mV DC signal with 50ohm impedance on oscilloscope (as attached photo);
Second stage, the old monitoring photodiode is broken, a new monitoring photodiode is connected, which we don't have reference data for it,
on the optical output port of the monitoring signal, it's written 150mW, but at where we measured 40mW. |
| Attachment 1: 1st_stage_amplifier_monitoring_photodiode_signal.jpg
|
 |
|
28
|
Fri Feb 1 14:04:27 2019 |
Loïc Amoudry | Fixed | info | lasers and optics | Other | Meeting with LMA people, AFM |
30/01/19 - The following powerpoint shows the results discussed with LMA people.
What came out from the discussion is:
- Their cleaning method uses demineralized water drop on a spinner. It is probably the explanation of the circular traces on the mirror's surfaces but we still don't know what is this deposit (XPS is running out on 2 of this mirrors at this time).
- According to their point of view, the spots could come from the coating deposition technique and are "normal". No real explaination, should not come from the substrat which is ultra-polished but can come from some clustering in the coating.
We gave them 2 of the mirrors so they can check if it is possible to clean them. They'll also do a measurement of the mirror's topology. |
| Attachment 1: POINT_SUR_LES_MIROIRS.pptx
|
|
27
|
Fri Feb 1 13:45:19 2019 |
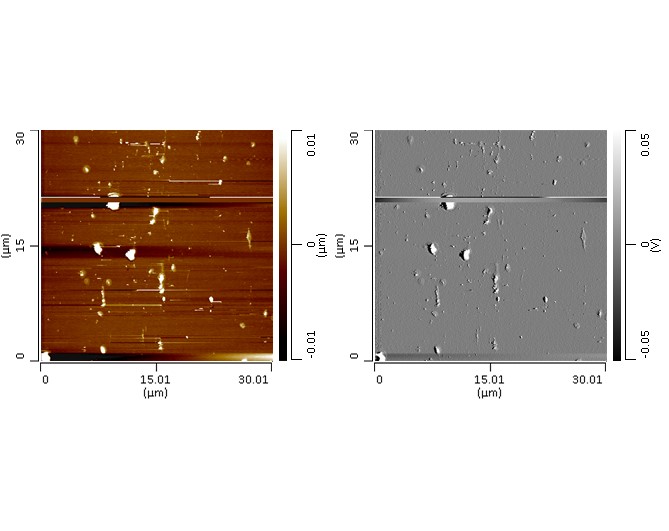
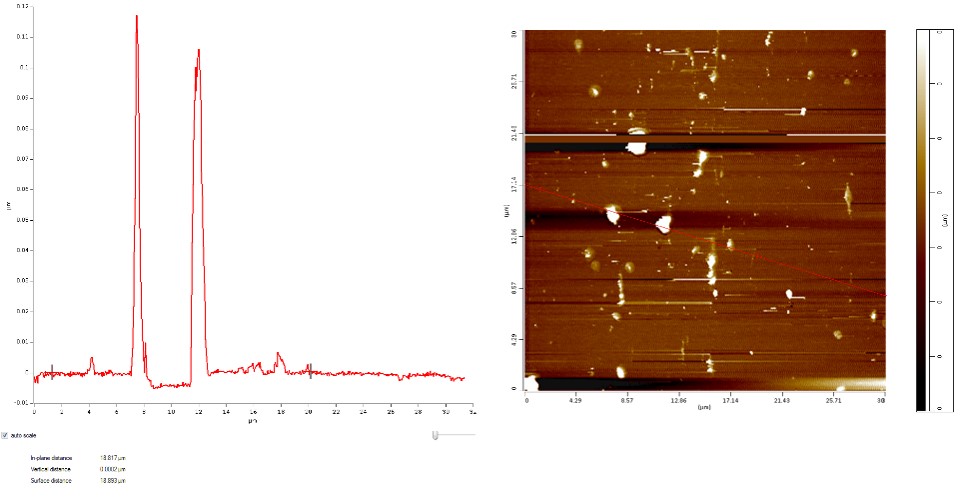
Loïc Amoudry | Fixed | report | lasers and optics | Other | AFM performed on S-BOX mirrors |
29/02/19 - AFM has shown that spots on mirror's surfaces are bumps and not holes. |
| Attachment 1: Image3.jpg
|
 |
| Attachment 2: Image4.jpg
|
 |
|
26
|
Thu Jan 24 17:49:54 2019 |
Loïc Amoudry | Fixed | report | lasers and optics | Optical room | Impacts on mirror's surface |
All the mirrors show impacts on there surface (some of them do not show deposit). Does it come from experiments or fabrication ? Are these holes or bumps ? |
| Attachment 1: 18_M1reflectiveface2x_compressed.jpg
|
 |
|
25
|
Thu Jan 24 17:44:21 2019 |
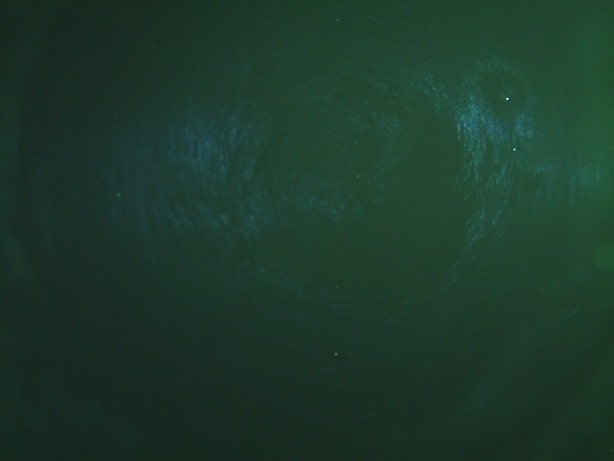
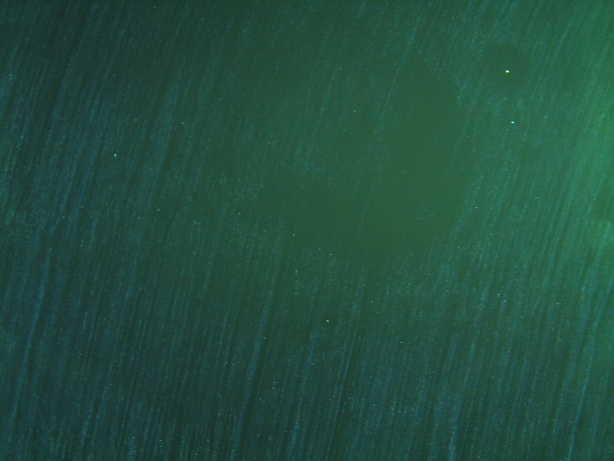
Loïc Amoudry | Fixed | report | lasers and optics | Optical room | Deposit on S-box mirrors after return from LMA |
Cleaning on dirty surface shows something is deposited on the surface. Cleaning displaces and removes part of the deposit. |
| Attachment 1: 28_M2ReflectiveBeforeCleaning_compressed.jpg
|
 |
| Attachment 2: 29_M2ReflectiveAfter1stCleanPaper_compressed.jpg
|
 |
|
24
|
Fri Dec 21 13:42:43 2018 |
Loïc Amoudry | Fixed | info | lasers and optics | Optical room | Mirrors features, come back from LMA |
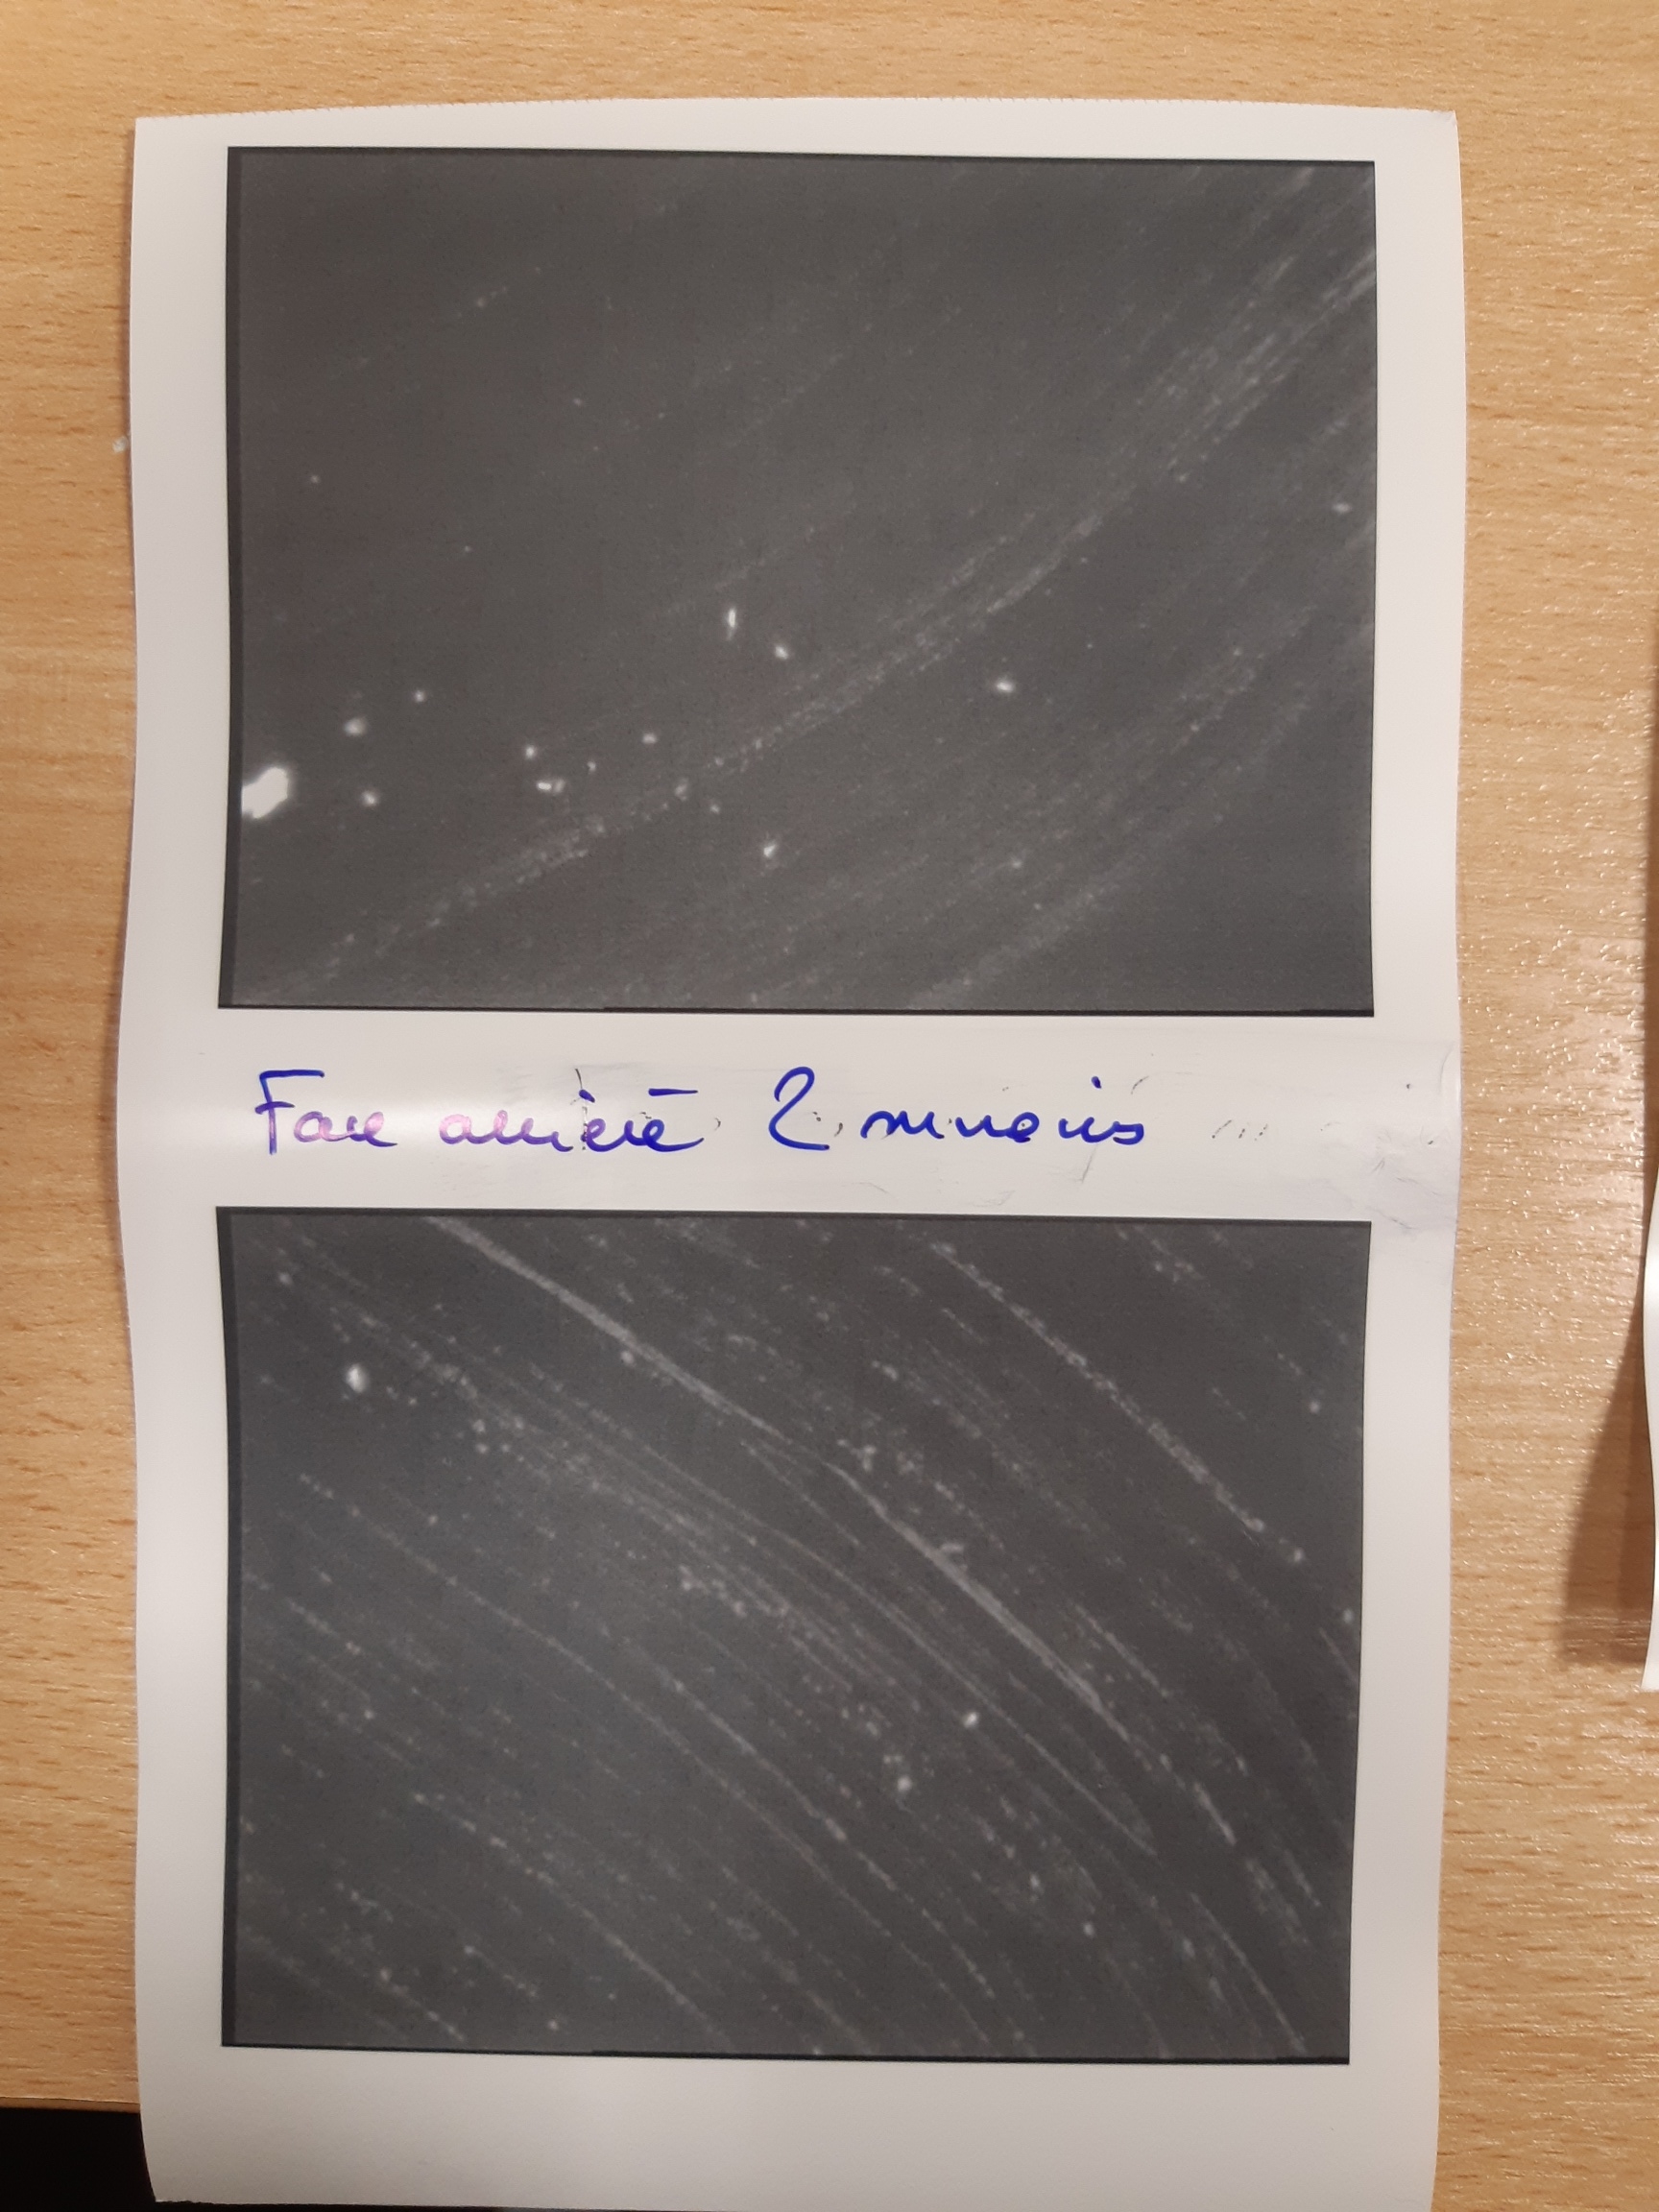
Mirrors arrived today from LMA. Their features are damaged.
Photos avant ou après nettoyage, pas clair dans le mail de Laurent :
"J'ai commencé à nettoyer M1 et M2 avec notr methode habituelle et je me suis aperçu que sur la partie centrale (en gros taille de ton faisceau j'ai l'impression) que des choses apparaissaient (voir photo)
Si bien que la diffusion n'a pas évolué dans le bon sens (diminution) voir empiré pour M1. J'ai donc arrêter de les nettoyer !!!
J'ai regardé les faces arrières des miroirs avant nettoyage et j'ai pu voir ce que tu vois sur la photo même au centre. Je sais pas de quoi cela peut venir.
Une chose est sûre le coating IBS a été altéré par je ne sais quoi dans ta manip provoquant cette dégradation dès qu'on y touche. L'interaction avec les faisceaux d'eélectrons n'avait jamais altéré les miroirs sur l'expértience DESY par exemple!!
Pour me rassurer, j'ai pris un miroir fait sur un micropoli qu'on a en stock et aucun pb lors du nettoyage (on peut penser à tout)"
|
| Attachment 1: 181201_caracteristiques_miroirs.PNG
|
 |
| Attachment 2: 20181207_155704_resized.jpg
|
 |
| Attachment 3: 20181207_155726_resized.jpg
|
 |
|
23
|
Thu Nov 15 13:02:44 2018 |
Loïc Amoudry | Fixed | info | lasers and optics | Optical room | Mirrors cleaning |
The new mirrors didn't give expected results. Then the 4 old mirrors have been sent to LMA on 12/11/18 for a cleaning and caracterization before and after cleaning. Also asked for a diffusion/absorption map on the mirrors if possible. They didn't really answered on what will they do.
Received on 13/11/18 by LMA. |
|
22
|
Mon Nov 5 13:11:08 2018 |
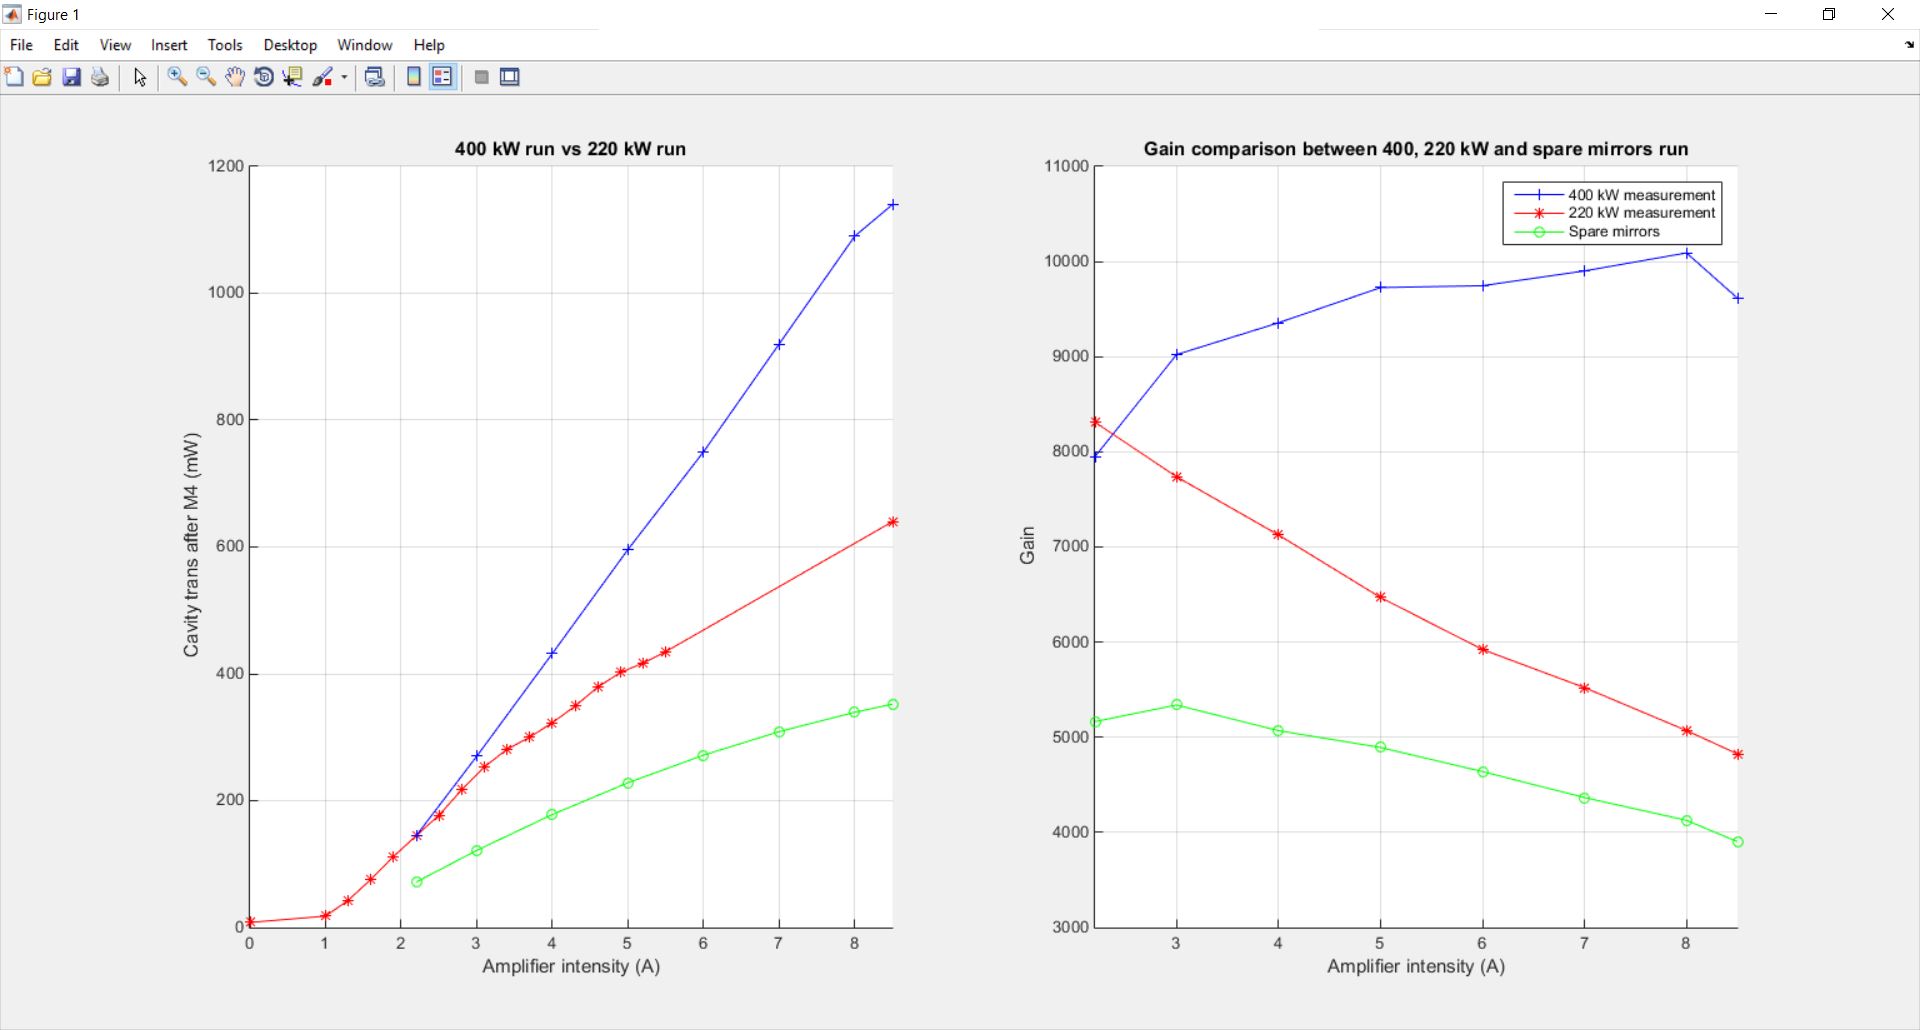
Loïc Amoudry | Fixed | report | lasers and optics | Optical room | First run with spare mirrors |
| I (A) |
Trans (mW) |
Coupling (%) |
Pin (W) |
Gain |
| 0 |
4 |
70 |
0.37 |
4982 |
| 2 |
58 |
80 |
5.2 |
5140 |
| 4 |
180 |
75 |
16.1 |
5152 |
| 6 |
270 |
63 |
27.3 |
4558 |
| 8 |
340 |
60 |
36.7 |
4269 |
|
| Attachment 1: Plot_power_and_gain_vs_all.JPG
|
 |
| Attachment 2: powerup.xlsx
|
|
21
|
Wed Oct 31 14:06:17 2018 |
Loïc Amoudry | Fixed | report | lasers and optics | Optical room | M1 transmission measurement |
At different positions, transmission give 194, 193, 208, 200 ppm?
| Loïc Amoudry wrote: |
|
Center of M1:
| I (A) |
Input power (mW) |
Transmitted power (mW) |
Transmission (ppm) |
| 0 |
78 |
0.01477 |
189 |
| 4 |
16500 |
3.2 |
194 |
|
|
|
20
|
Wed Oct 31 14:04:50 2018 |
Loïc Amoudry | Fixed | report | lasers and optics | Optical room | M4 transmission measurement |
| Loïc Amoudry wrote: |
|
The kept transmission for M4 is 2.17 ppm. Which is the value measured after alignement (center of the mirror).
These measurements have been taken before alignement.
| I (A) |
Input power (mW) |
Transmitted power after window (mW) |
Transmission (ppm) |
| 0 |
74.3 |
195.2e-6 |
2.63 |
| 0 |
73.5 |
212.8e-6 |
2.89 |
| 0 |
52.4 |
151e-6 |
2.88 |
| 6 |
28 400 |
72e-3 |
2.54 |
High dependence against the position. Few measurement several mm away from the center each one at different position give 2.86, 2.68, 2.93, 3.01, 3.06, 3.35 ppm.
|
|
|
19
|
Wed Oct 31 14:03:22 2018 |
Loïc Amoudry | Fixed | report | lasers and optics | Optical room | M4 transmission measurement |
The kept transmission for M4 is 2.17 ppm. Which is the value measured after alignement (center of the mirror).
These measurements have been taken before alignement.
| I (A) |
Input power (mW) |
Transmitted power after window (mW) |
Transmission (ppm) |
| 0 |
74.3 |
195.2e-6 |
2.63 |
| 0 |
73.5 |
212.8e-6 |
2.89 |
| 0 |
52.4 |
151e-6 |
2.88 |
| 6 |
28 400 |
72e-3 |
2.54 |
High dependence against the position. Few measurement several mm away from the center each one at different position give 194, 193, 208, 200 ppm. |
|
18
|
Wed Oct 31 13:51:17 2018 |
Loïc Amoudry | Fixed | info | lasers and optics | Optical room | Change of the 3 ULE mirrors by 3 spare ULE mirrors |
First finesse measurement 20 266, FSR 133.351 MHz under vacuum |
| Attachment 1: Miroirs_à_1031_nm-ThomX_-_décembre2017.pdf
|
| Attachment 2: vacuum.isf
|
|
17
|
Wed Oct 31 13:48:58 2018 |
Loïc Amoudry | Fixed | report | lasers and optics | Optical room | M1 transmission measurement |
Center of M1:
| I (A) |
Input power (mW) |
Transmitted power (mW) |
Transmission (ppm) |
| 0 |
78 |
0.01477 |
189 |
| 4 |
16500 |
3.2 |
194 |
|
|
16
|
Wed Oct 31 13:44:22 2018 |
Loïc Amoudry | Fixed | report | lasers and optics | Optical room | Finesse vs power by difference between main and second resonance |
Measurement on 25/10/2018
| Loïc Amoudry wrote: |
|
Measurements show that ratio decrease versus power. BUT, the second resonance measurement induce lower power in the cavity so the ratio is not directly true.
Also, simulation of the main/second resonance power by Pierre's simulation has shown ratio ~50, ~47.6 and 43.5 respectively for 0A, 2A and 4A.
| I (A) |
Main resonance (mW) |
Second resonance (mW) |
Ratio |
| 0 |
8.07 |
0.416 |
19.4 |
| 2 |
121 |
6.77 |
17.9 |
| 4 |
324 |
20.2 |
16 |
|
|
|
15
|
Wed Oct 31 13:43:28 2018 |
Loïc Amoudry | Fixed | report | lasers and optics | Optical room | Finesse vs power by difference between main and second resonance |
Measurement on 24/10/18
| Loïc Amoudry wrote: |
|
Measurements show that ratio decrease versus power. BUT, the second resonance measurement induce lower power in the cavity so the ratio is not directly true.
Also, simulation of the main/second resonance power by Pierre's simulation has shown ratio ~50, ~47.6 and 43.5 respectively for 0A, 2A and 4A.
| I (A) |
Main resonance (mW) |
Second resonance (mW) |
Ratio |
| 0 |
8.07 |
0.416 |
19.4 |
| 2 |
121 |
6.77 |
17.9 |
| 4 |
324 |
20.2 |
16 |
|
|
|
14
|
Wed Oct 31 13:43:03 2018 |
Loïc Amoudry | Fixed | report | lasers and optics | Optical room | Polarization frequency |
Measurement on 30/10/18.
| Loïc Amoudry wrote: |
|
Check of the frequency of the onefive locked on each polarization of the cavity (tilt a waveplate by 45°).
Frequency repetition rate : 133.335 MHz on spectrum analyzer for both polarization locked.
|
|
|
13
|
Wed Oct 31 13:42:22 2018 |
Loïc Amoudry | Fixed | report | lasers and optics | Optical room | Polarization frequency |
Check of the frequency of the onefive locked on each polarization of the cavity (tilt a waveplate by 45°).
Frequency repetition rate : 133.335 MHz on spectrum analyzer for both polarization locked. |
|
12
|
Wed Oct 31 11:36:30 2018 |
Loïc Amoudry | Fixed | report | lasers and optics | Optical room | Finesse vs power by difference between main and second resonance |
Measurements show that ratio decrease versus power. BUT, the second resonance measurement induce lower power in the cavity so the ratio is not directly true.
Also, simulation of the main/second resonance power by Pierre's simulation has shown ratio ~50, ~47.6 and 43.5 respectively for 0A, 2A and 4A.
| I (A) |
Main resonance (mW) |
Second resonance (mW) |
Ratio |
| 0 |
8.07 |
0.416 |
19.4 |
| 2 |
121 |
6.77 |
17.9 |
| 4 |
324 |
20.2 |
16 |
|
| Attachment 1: CrossSecondaryResonance.m
|
clear all; close all;
tic
addpath(genpath('C:\Users\amoudry\desktop\Fichiers Labo\Fichiers Pierre\Simulation\Personal codes\Various'))
[TAS,~,r] = GetCavity('SBOX_ULE');
[F,~] = Get_info(TAS(1:4),TAS(5:8),TAS(9:12));
lambda = 1030e-9;
c = 299792458;
FSR = 133.33e6;
w0 = 2*pi*c/lambda;
tau = 1e-12; % FWHM duration
a = 4*log(2)/tau^2;
E0 = 1;%(pi/2/a)^(1/2); % Energy to normalize gaussian spectrum (Input beam power = 1)
DeltaPhiCE = 0; % CEP
N = 1e5;

dk = 0:(N-1);
Aa = (r.^dk-r.^(2.*N-dk));
Bb = E0*TAS(1)./(1-r.^2);
Cc = (1-r.^(2.*N));

Nn = 5e2; % Increase Nn <-> increase resolution
dtt = -Nn:Nn;
dtt = dtt*lambda/c/(0.1*Nn); %1e6
Ecn = zeros(numel(dtt),1);
for ii = 1:numel(dtt)
    for ll = 0:3
%         ll = 0;
        dt = dtt(ii)+ll*lambda/c;
        Phid = DeltaPhiCE + w0.*dt;
        temp_vect = Aa.*cos(dk.*Phid).*exp(-a.*dk.^2.*dt.^2./2);
        Ecn(ii,ll+1) = Bb.*(2*sum(temp_vect)-Cc);
        disp([num2str(ii)]);
    end
end
toc
%% Time plots
% figure
% semilogy(dtt/lambda*c,Ecn/max(Ecn),'LineWidth',2)
% hold on
% semilogy(dtt/lambda*c,Ecn2/max(Ecn),'LineWidth',2)
% hold on
% semilogy(dtt/lambda*c,Ecn3/max(Ecn),'LineWidth',2)
% hold on
% semilogy(dtt/lambda*c,Ecn4/max(Ecn),'LineWidth',2)
% set(gca,'FontSize',15)
% xlabel('\DeltaT (\lambda/c)')
% ylabel('Energy (A.U.)')
% grid on
% legend('\DeltaT = 0','\DeltaT = \lambda/c','\DeltaT = 2\lambda/c','\DeltaT = 3\lambda/c')
% axis square

% figure
% semilogy(dtt/lambda*c,Ecn/max(Ecn),'LineWidth',2)
% grid on
% set(gca,'FontSize',25)
% % set(gca,'YLim',[1e-9 1e0])
% xlabel('\DeltaT (\lambda_0/c)')
% ylabel('log(Energie (u.a.))')

%% Frequency
nu0 = w0/2/pi;
frep = (1/FSR-nu0/FSR*dtt).^(-1); % Infinity in dtt = 1/nu0

fprintf('\nFinesse : %g\n\n',F);
% Get linewidth
figure
for jj = 1:4
%     Find the 2 minimas of Ecn_half. Take the corresponding frep and
%     substract them
    Ecn_half = abs(Ecn(:,jj)-max(Ecn(:,jj))/2);
    Ecn_half2 = sort(Ecn_half);
    [row1,~] = find(Ecn_half==Ecn_half2(1),1);
    [row2,~] = find(Ecn_half==Ecn_half2(2),2);
    if numel(row2)>1  % Sometimes row can be a vector
        row2 = row2(2);
    end
    dnu = abs(frep(row2)-frep(row1));
    fprintf('RES %g\nMax gain : %g. Linewidth : %g kHz\n\n',jj-1,max(Ecn(:,jj)),dnu/1e3);

%     plot((frep-FSR)/FSR,Ecn(:,jj)/max(Ecn(:,1)),'LineWidth',2)
%     hold on
    semilogy((frep-FSR)/FSR,Ecn(:,jj)/max(Ecn(:,1)),'LineWidth',2)
    xlim([-0.05 0.05])
    hold on
end
set(gca,'FontSize',15)
xlabel('(f_r_e_p-FSR)/FSR')
% ylabel('Energy (A.U.)')
ylabel('log(Energie (u.a.))')
grid on
legend('\DeltaT = 0','\DeltaT = \lambda/c','\DeltaT = 2\lambda/c','\DeltaT = 3\lambda/c')
axis square
% axis([-0.01 0.01 10^-6 1])
|
| Attachment 2: GetCavity.m
|
function [TAS,r,r_prod] = GetCavity(cav_name,varargin)
% Return T and r coefficient of a given cavity
% TAS vector contains the 4 T coeffs, then 4 A coeffs, then 4 S coeffs

if strcmp(cav_name,'SBOX_ULE')==1
    TAS(1) = 180e-6;   % T
    TAS(2) = 2e-6;
    TAS(3) = 2e-6;
    TAS(4) = 2e-6;
    TAS(5) = 1.15e-6;  % A
    TAS(6) = 1.27e-6;
    TAS(7) = 1.2e-6;
    TAS(8) = 1e-6;
    TAS(9) =  7e-6;     % S
    TAS(10) = 4.5e-6;
    TAS(11) = 3.6e-6;
    TAS(12) = 9e-6;
%     TAS(1) = 180e-6;   % T
%     TAS(2) = 3.2e-6;
%     TAS(3) = 2.8e-6;
%     TAS(4) = 2.85e-6;
%     TAS(5) = 30e-6;  % A
%     TAS(6) = 30e-6;
%     TAS(7) = 30e-6;
%     TAS(8) = 30e-6;
%     TAS(9) = 20e-6;     % S
%     TAS(10) = 20e-6;
%     TAS(11) = 20e-6;
%     TAS(12) = 20e-6;

elseif strcmp(cav_name,'ThomX')==1
    TAS(1) = 120e-6;   % T
    TAS(2) = 1.5e-6;
    TAS(3) = 1.5e-6;
    TAS(4) = 1.5e-6;
    TAS(5) = 0.4e-6;  % A
    TAS(6) = 0.24e-6;
    TAS(7) = 0.24e-6;
    TAS(8) = 0.27e-6;
    TAS(9) = 4e-6;     % S
    TAS(10) = 4.5e-6;
    TAS(11) = 10e-6;
    TAS(12) = 4.5e-6;

elseif strcmp(cav_name,'MIGHTY_low')==1
    TAS(1) = 1060e-6;
    TAS(2) = 330e-6;
    TAS(3) = 330e-6;
    TAS(4) = 330e-6;
    TAS(5:12) = 0;

elseif strcmp(cav_name,'Fab_cav')==1
    TAS(1) = 100e-6;
    TAS(2) = 10e-6;
    TAS(3) = 10e-6;
    TAS(4) = 10e-6;
    TAS(5:12) = 0;
end

switch nargin
    case 2
        TAS = repmat(TAS,numel(varargin{1}),1);
        TAS(:,1) = varargin{1};
    case 3
        TAS = repmat(TAS,numel(varargin{1}),1);
        TAS(:,1) = varargin{1};
        TAS(:,2) = varargin{2};
end

% Field reflection coeffs
rr = @(TAS) (1-sum(TAS,2)).^(1/2);
for ii = 1:4
    r(:,ii) = rr(TAS(:,ii:4:12));
end
r_prod = prod(r,2);
end
|