| ID |
Date |
Author |
Status |
Type |
Category |
Location |
Title |
|
50
|
Fri Jan 24 17:56:11 2020 |
Loïc Amoudry | Fixed | info | lasers and optics | Optical room | AFM analysis of M2 |
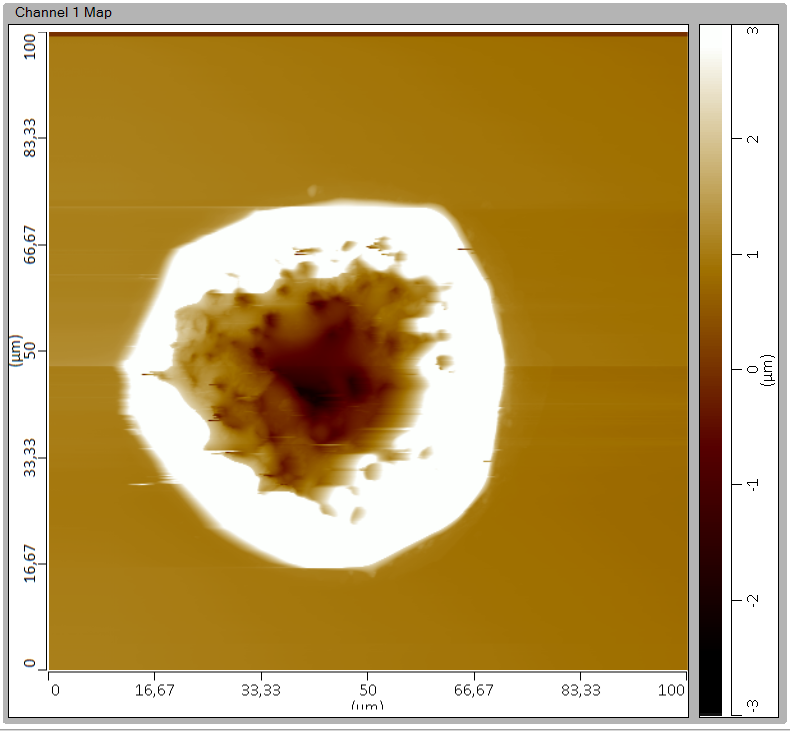
We had enough time to proceed a quick scan of M2 which has also a hole but not centered on the mirror.
The hole is larger and higher than the one on M1. But the vertical range was to high for the AFM. Then we cannot see if there are sparkles or not on this image. Further study with microscope would be welcome. |
| Attachment 1: M2.PNG
|
 |
|
49
|
Fri Jan 24 17:52:14 2020 |
Loïc Amoudry | Fixed | report | lasers and optics | Optical room | AFM analysis of M1 |
AFM has been proceeded on M1 and M2.
The pdf shows the first images taken with the PLIC room Leica microscope (zoom x10 and x80).
Then the hole has been studied with a handmade microscope. It brought a better resolution. We can now see the hole has an edge, a center structure and and extra-hole sparkle (pailleté) structure.
The AFM shows these 3 structures are real. The top of the hole is at ~+1µm and the center ~-2µm compare to the coating surface. The sparkles are ~10nm high and we also found kind of "explosion" desposit while zooming on the sparkles.
The 3D view and profil show perfectly the "crater". |
| Attachment 1: 200115_AFM_miroirs.pdf
|
|
48
|
Fri Jan 24 16:16:24 2020 |
Ronic Chiche | Fixed | report | lasers and optics | Optical room | analysis of stored and reflected power |
A chart which summarizes the data we have or we can estimate.
in orange, the case 1, where we suppose the initial cold Finesse is the one measured by modulation technique in December 2019 (F=20.8k).
and in green, the case 2, where we suppose the initial cold Finesse is the one measured by "zero compensation" technique between transmission and reflection signals during the power-up measurements (F~11k).
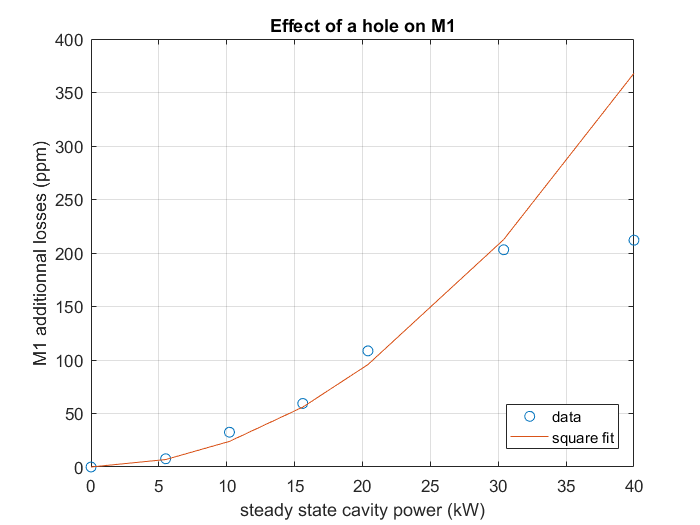
clearly, the case which matches better the only one data (written in red) of input power and then of cavity gain, is the Finesse estimated by the "zero compensation" technique. it matches also better the gain of the cavity measured after M1 had its hole and for which the estimated Finesse of 4k, and then estimated gain of 277 by "zero compensation" technique is not so far from the measurement of 185 (the gain is may be higher than 185 as it is possible we had some additional misalignment which reduced the gain).
| Ronic Chiche wrote: |
|
the 10th of January, we increased the power of the amplifier to study the cavity transmitted and reflected power signals.
analyzing the noise transfer functions of transmitted and reflected power one could deduce the Finesse of the cavity.
the power of this technic (if it is confirmed) does not depend on the decay time of one signal which depends on the speed of the cut off but on the difference between reflected and transmitted transfer functions,
and then is independant of the cut off speed.
here are 6 analysis of the Finesse when the cavity is cold, depending only on short lock periods.
5 of them agrees on a Finesse around 11k.
the 6th estimation at 40kW stored in the cavity is about 4k but now, we know that the M1 mirror had suddenly a hole for this power... thus the Finesse value is reasonable.
we can then, use the non conservation of TRANS+REF signal to estimate the FInesse decrease when the cavity is hot... to be done
|
|
| Attachment 1: Losses.pdf
|
| Attachment 2: M1_losses_vs_Pcav.png
|
 |
|
47
|
Fri Jan 10 18:51:23 2020 |
Ronic Chiche | Fixed | report | lasers and optics | Optical room | analysis of stored and reflected power |
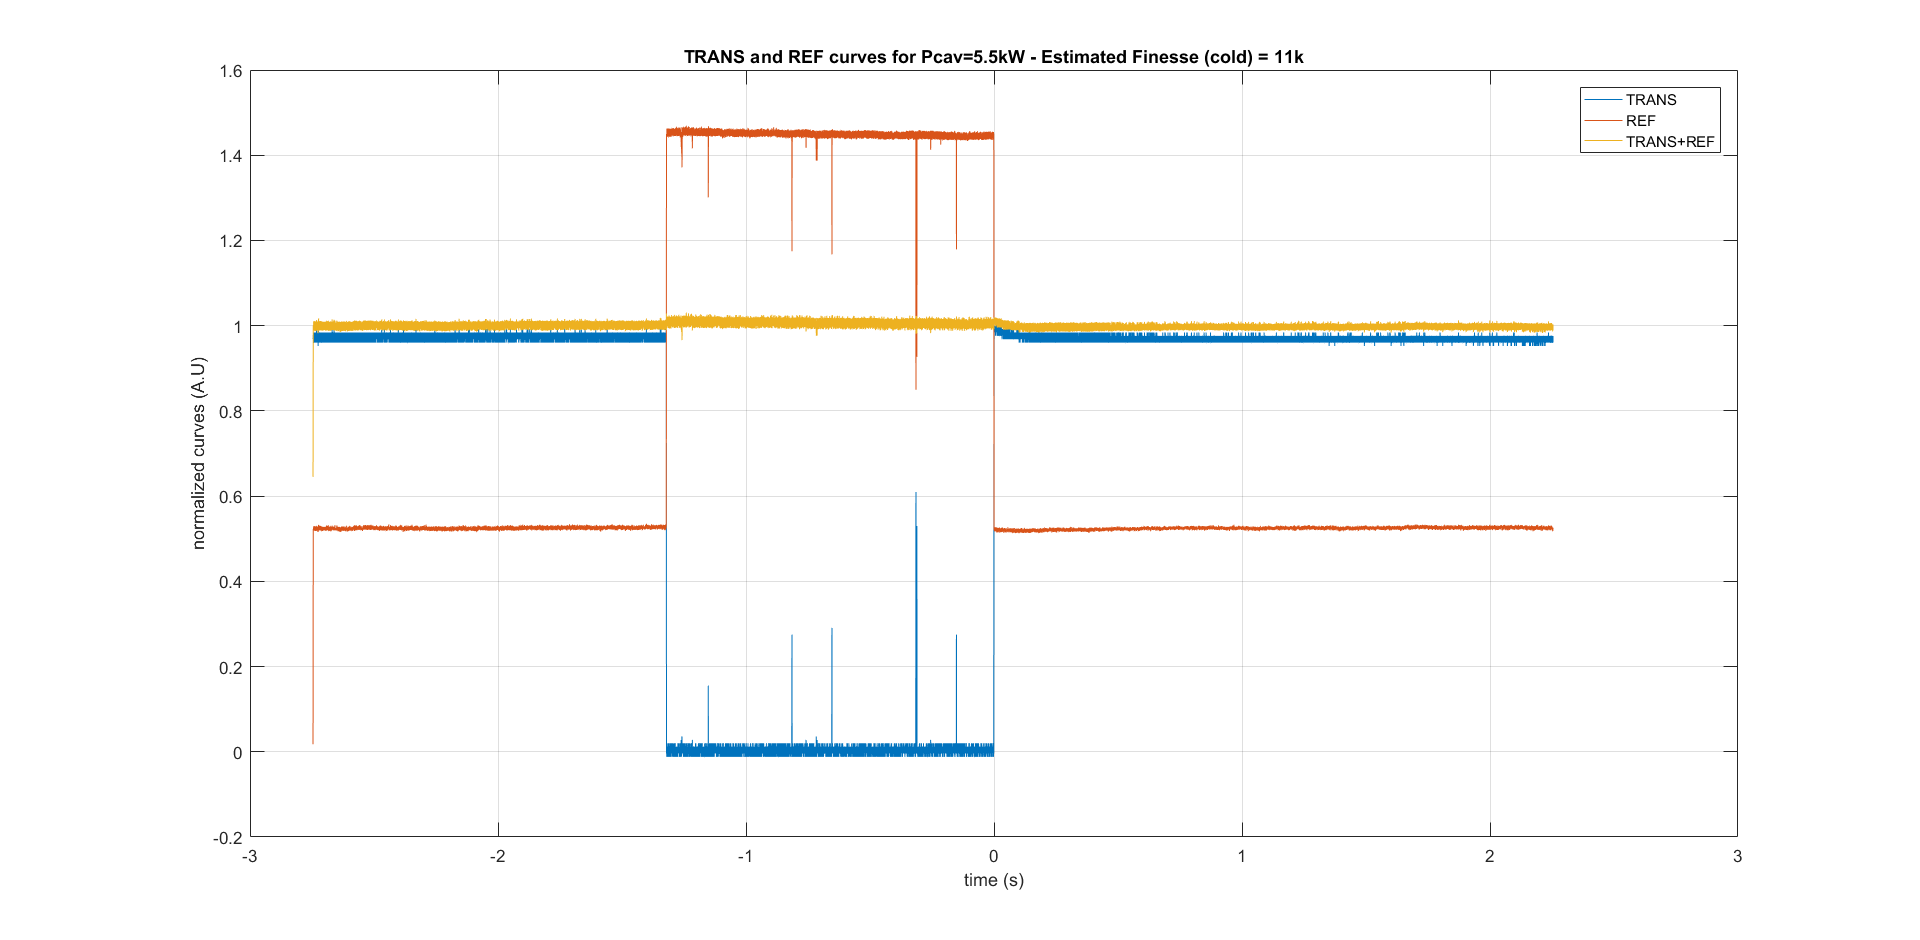
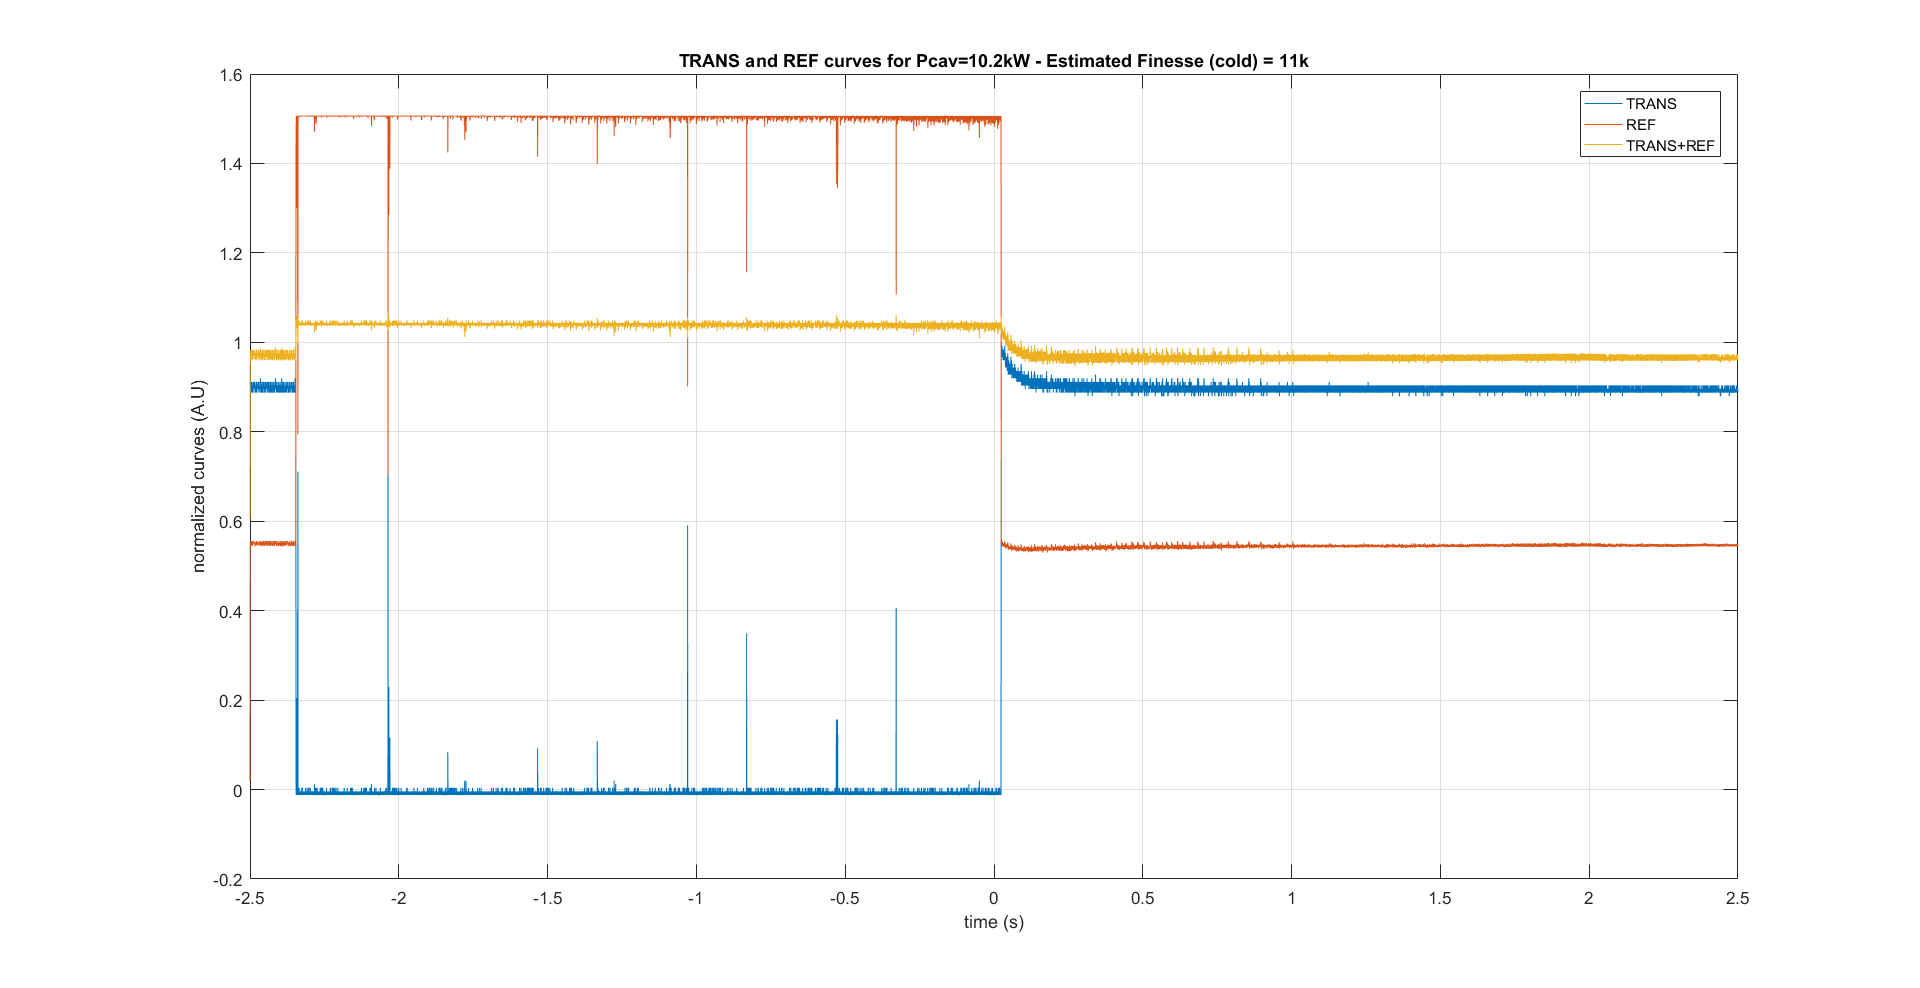
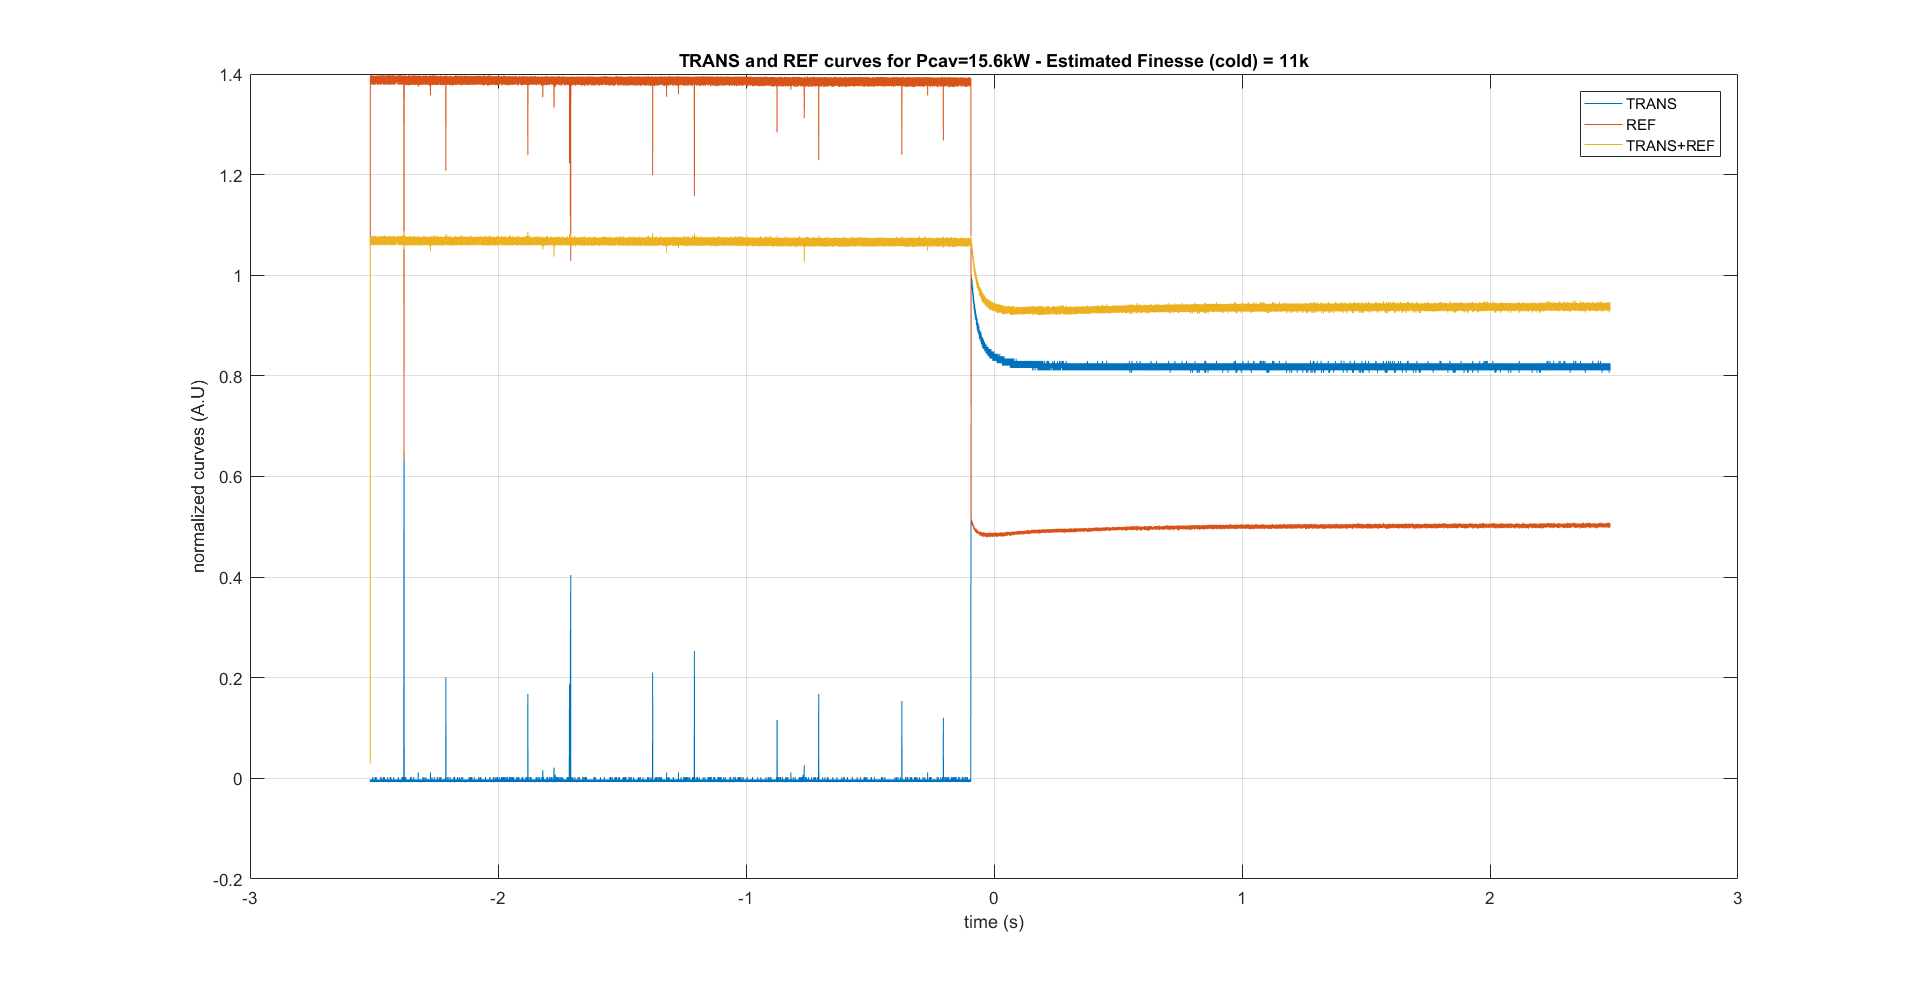
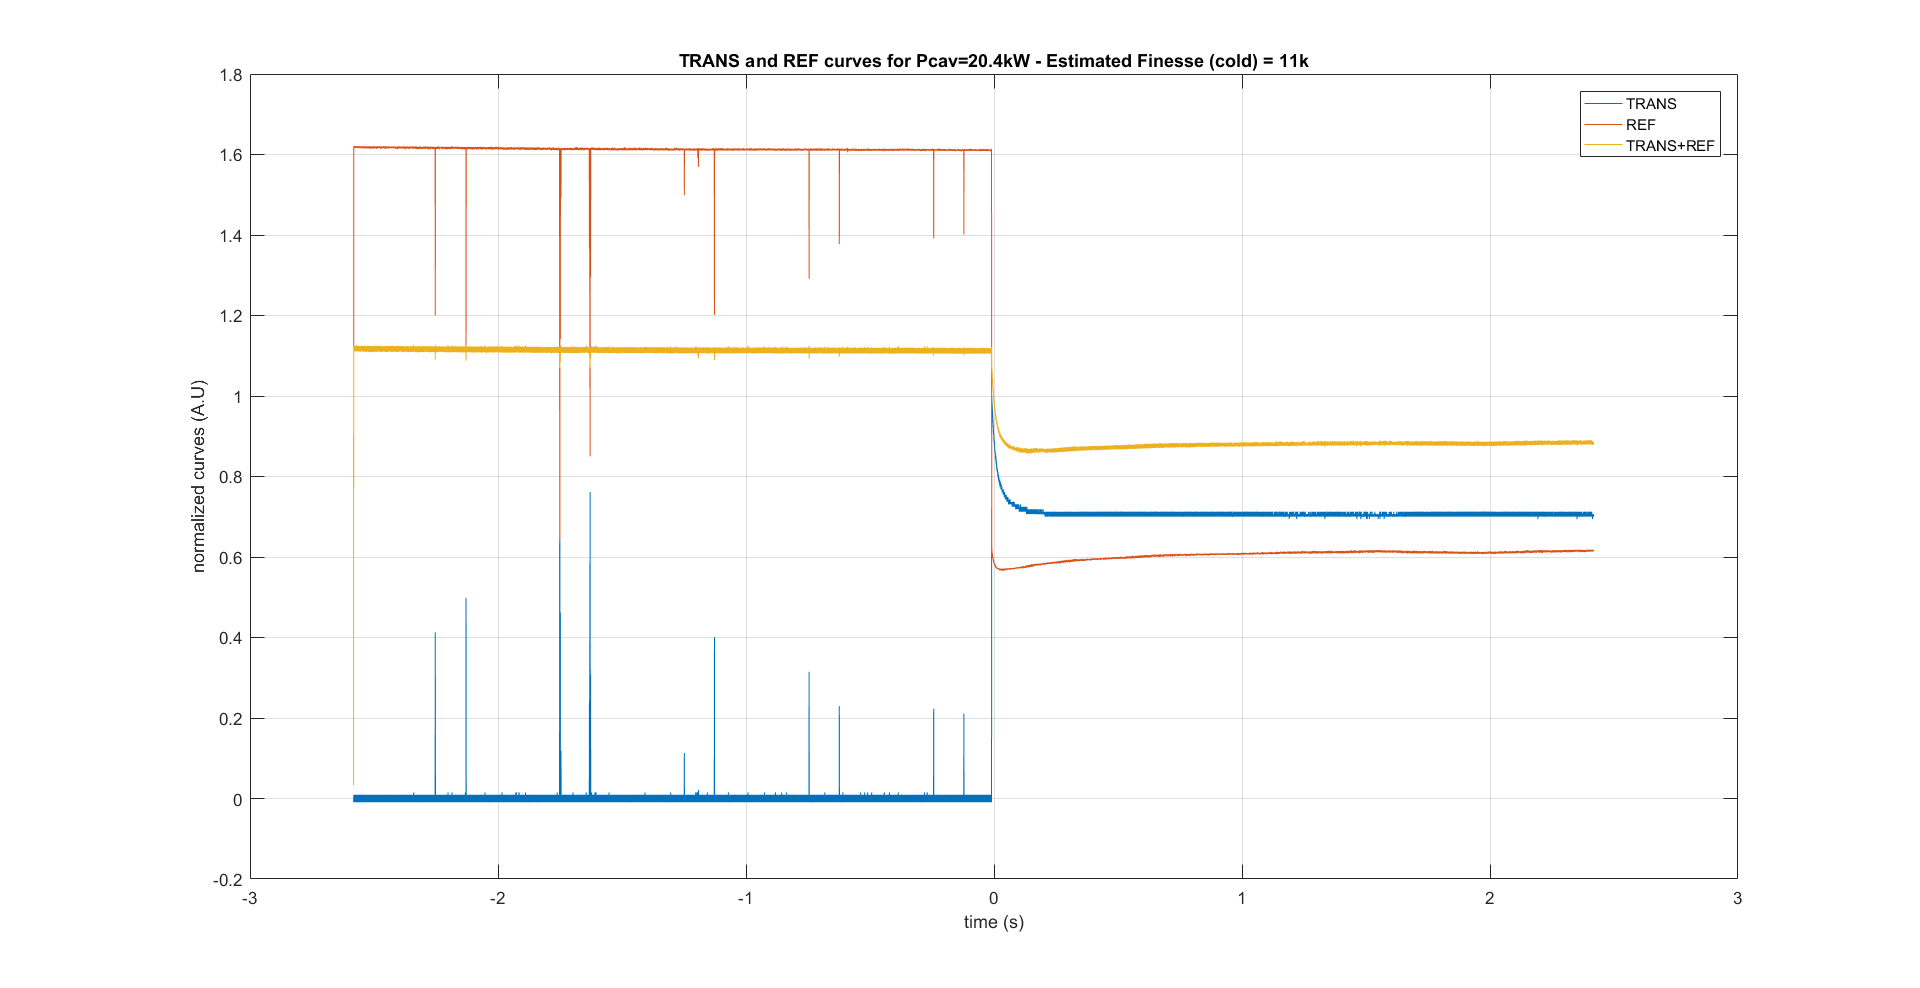
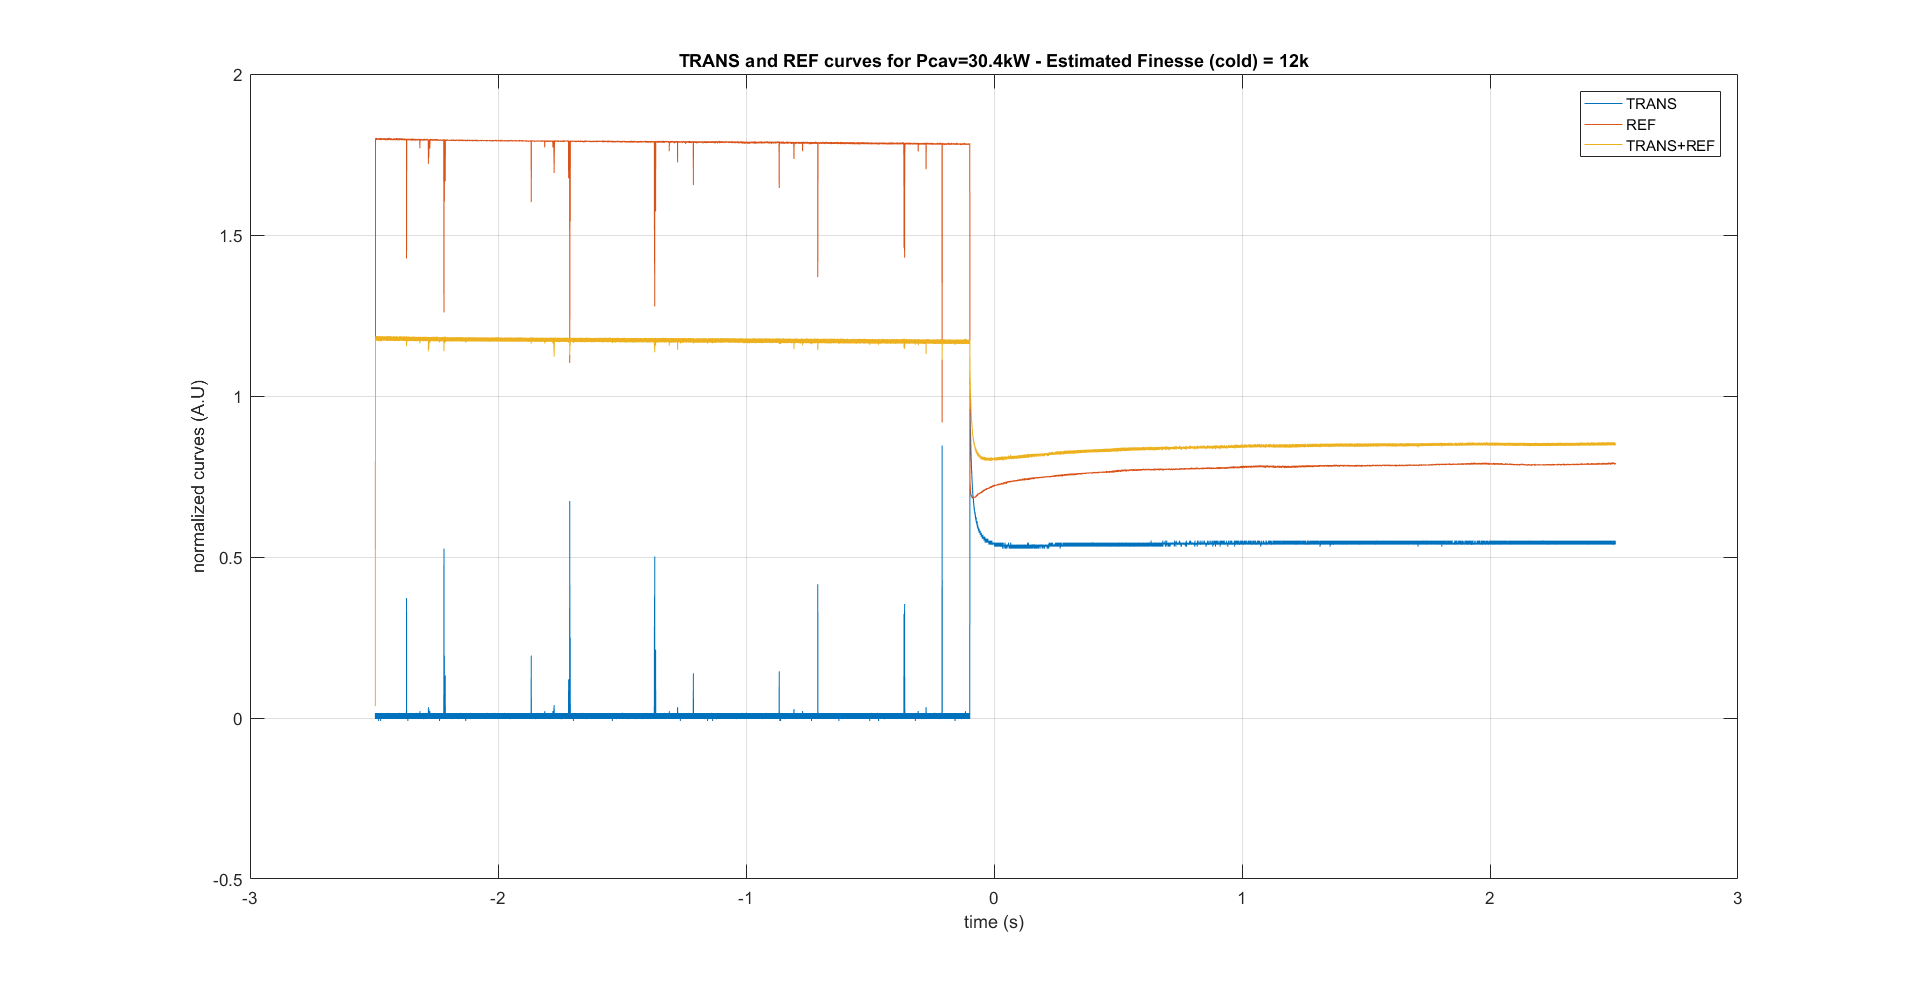
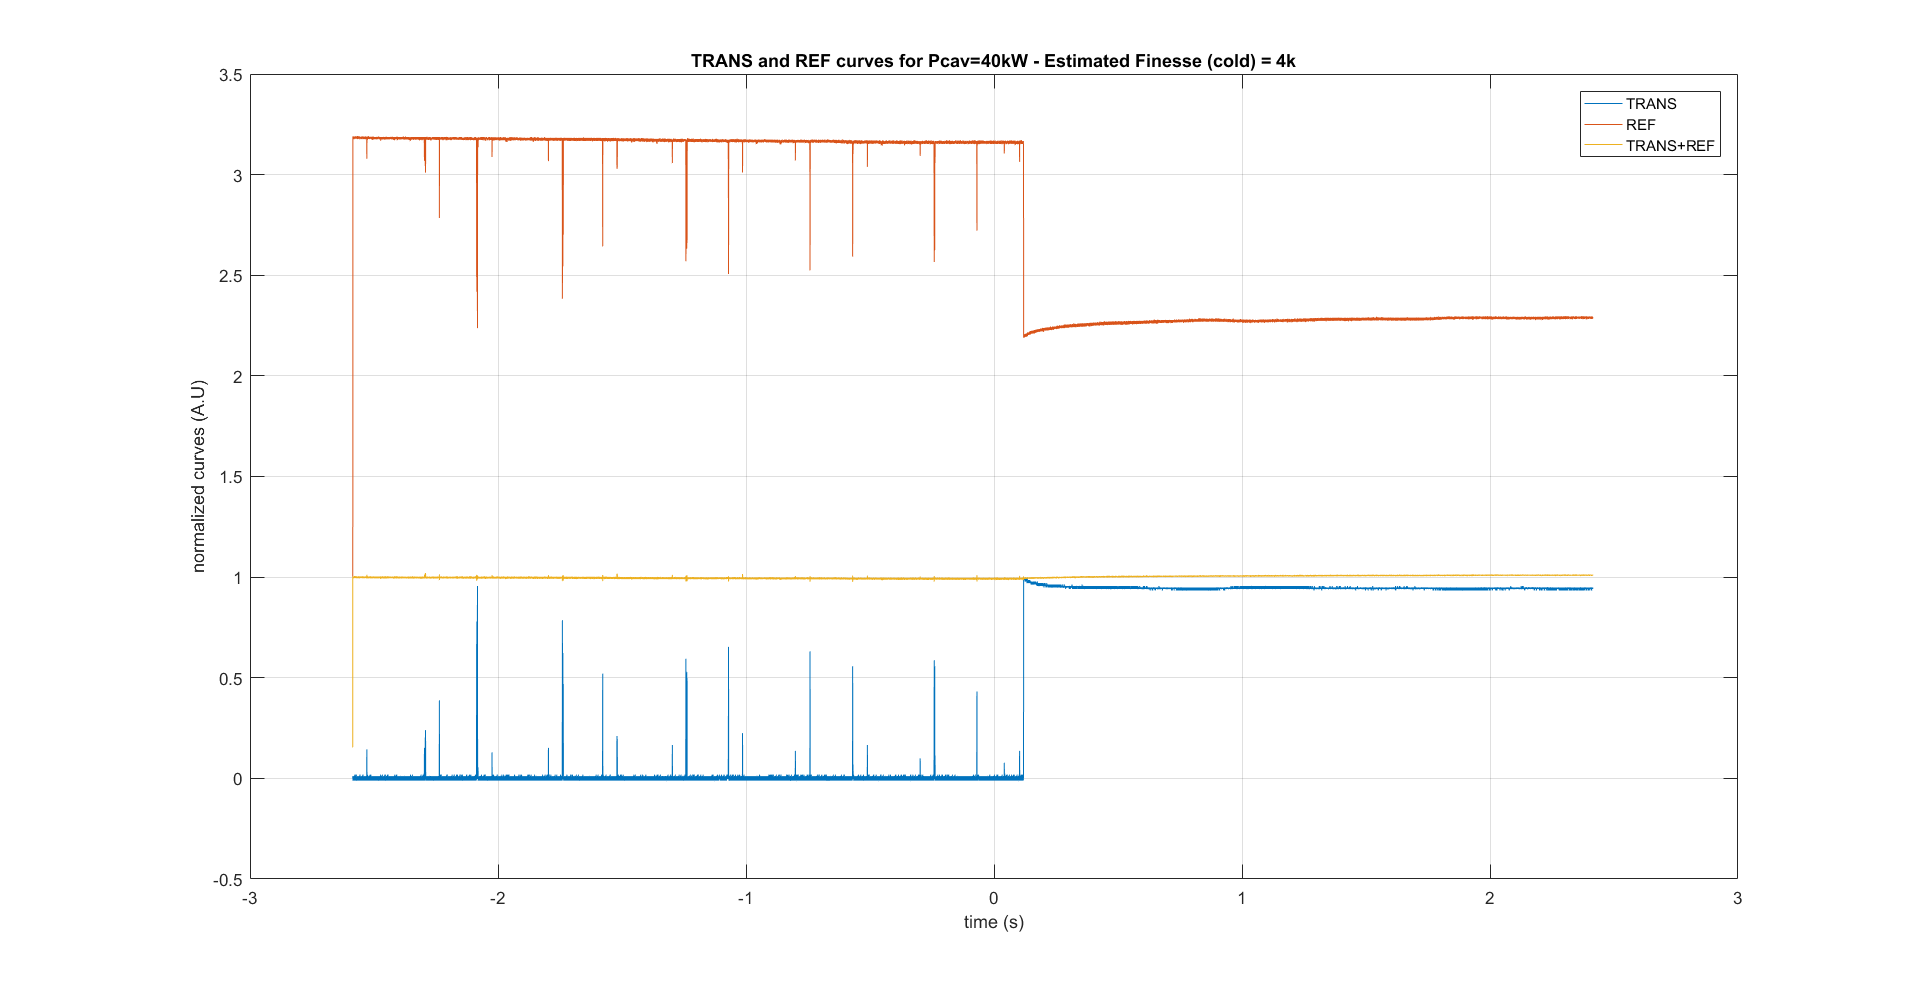
the 10th of January, we increased the power of the amplifier to study the cavity transmitted and reflected power signals.
analyzing the noise transfer functions of transmitted and reflected power one could deduce the Finesse of the cavity.
the power of this technic (if it is confirmed) does not depend on the decay time of one signal which depends on the speed of the cut off but on the difference between reflected and transmitted transfer functions,
and then is independant of the cut off speed.
here are 6 analysis of the Finesse when the cavity is cold, depending only on short lock periods.
5 of them agrees on a Finesse around 11k.
the 6th estimation at 40kW stored in the cavity is about 4k but now, we know that the M1 mirror had suddenly a hole for this power... thus the Finesse value is reasonable.
we can then, use the non conservation of TRANS+REF signal to estimate the FInesse decrease when the cavity is hot... to be done
|
| Attachment 1: TRANS_&_REF.png
|
 |
| Attachment 2: TRANS_&_REF.png
|
 |
| Attachment 3: TRANS_&_REF.png
|
 |
| Attachment 4: TRANS_&_REF.png
|
 |
| Attachment 5: TRANS_&_REF.png
|
 |
| Attachment 6: TRANS_&_REF.png
|
 |
|
46
|
Thu Jan 9 16:54:05 2020 |
Loïc Amoudry | Fixed | report | lasers and optics | Optical room | Microscope and cleaning of SBOX mirrors |
The mirrors went in the cavity the 28th of november (We did several power up to 30kW stored and only one to 40kW then the power went down to 2kW during the run).
Microscope study shows that mirrors get some dust during the handling [travel from microscope to SBOX --> installation --> in SBOX for +1month and power up --> travel to microscope].
Almost all of these dusts can be removed with cleaning.
There is only one important difference between 28th of november and today, a large spot on M1. |
| Attachment 1: resume_nettoyage_apres_sejour_dans_K-BOX_et_montee_en_puissance.PNG
|
 |
|
45
|
Thu Dec 19 16:23:39 2019 |
Ronic Chiche | Fixed | info | lasers and optics | Optical room | Cavity beam axis moving with power |
how the cavity beam axis is moving during a lock when the cavity is hot ?
could it explain a part of the Transmission / Coupling signal decay ?
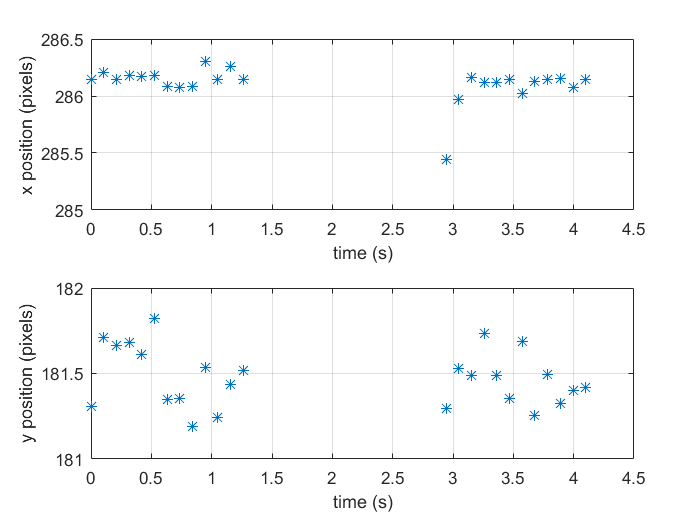
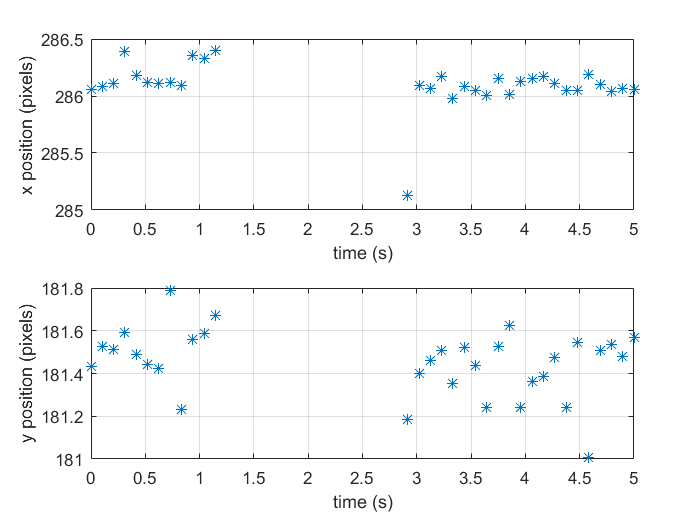
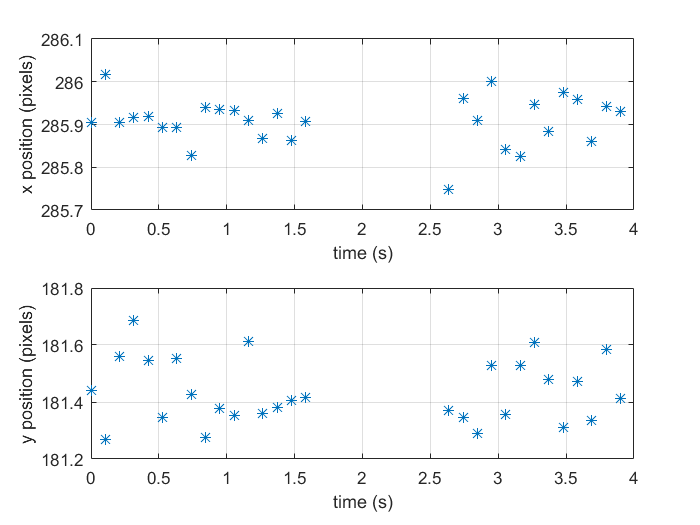
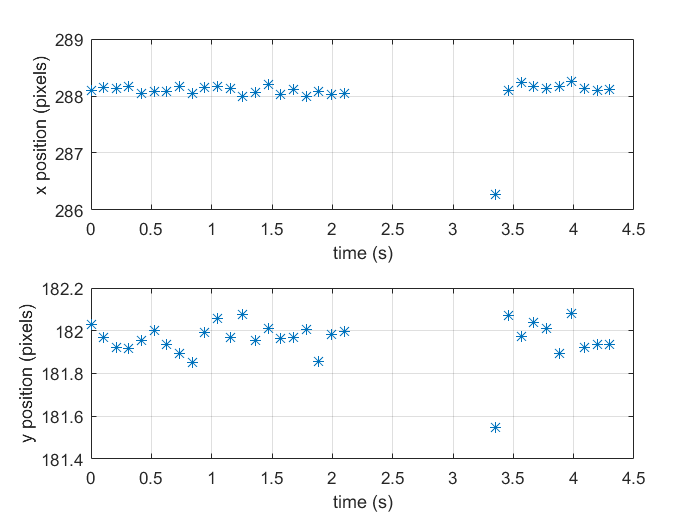
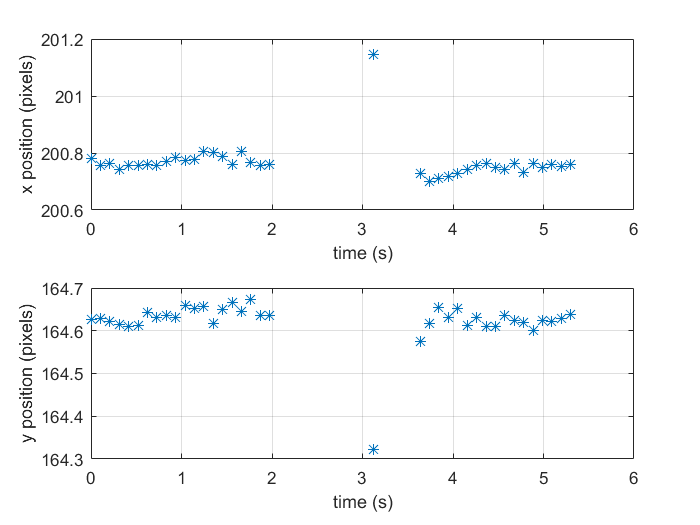
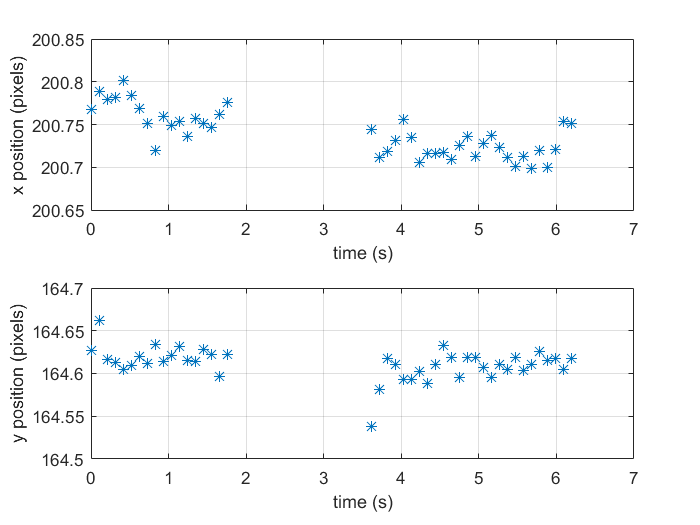
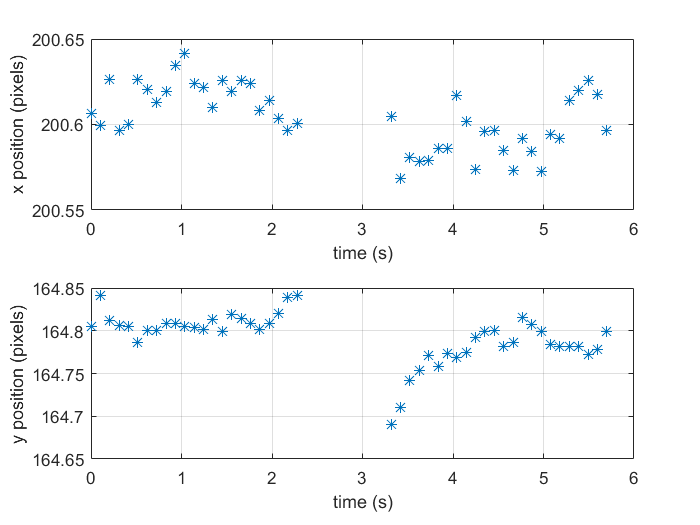
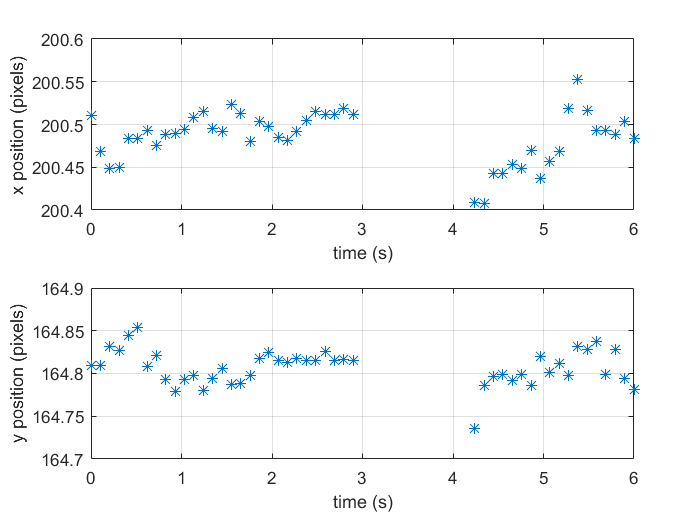
we placed 2 Basler camera, one at (30+Z) cm and the other at (85+Z) cm (Z is about 15cm) from the M3 mirror, we recorded the video during a lock and we analyzed the centroid X and Y displacement at 2A and 3A.
frames acquisition speed is a quite slow ~ 100ms => we need to acquire the frames faster !
with these data, the displacement is no more than some pixels, which means << 100µm ... it should be completely negligeable for photdiode thorlabs DET100 with ~10mm of diameter.
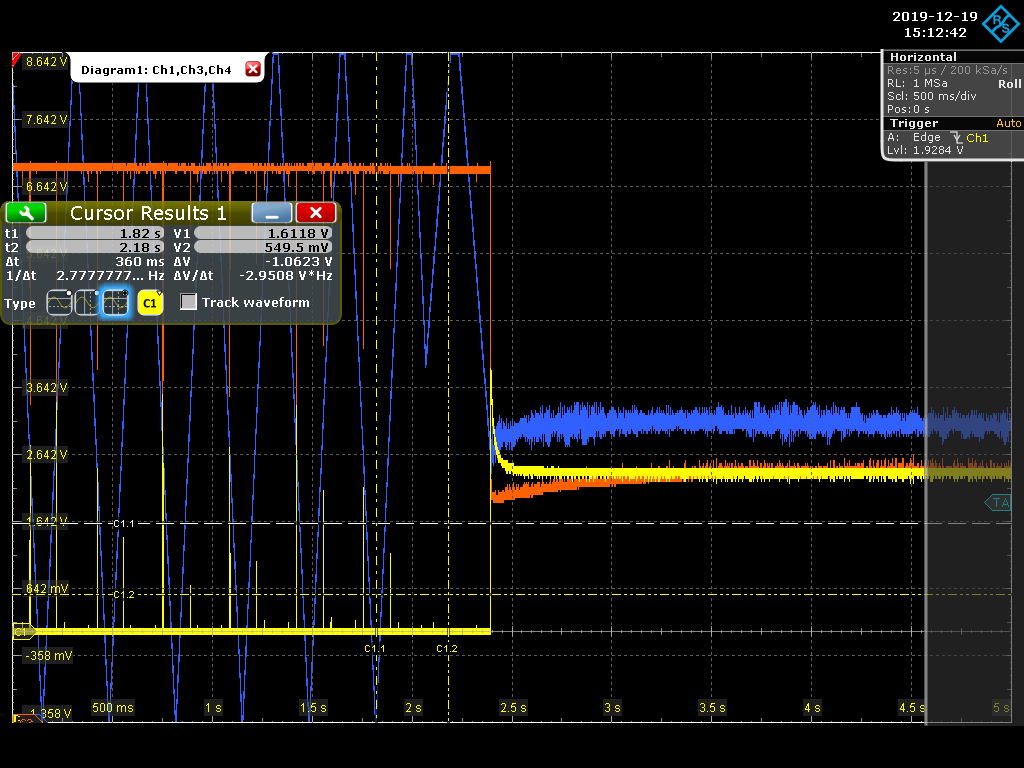
the last picture displays typical locking curves (before and after lock) :
- transmission : yellow
- coupling : orange
- PZT correction : blue |
| Attachment 1: Basler_30cm_2A_v1.png
|
 |
| Attachment 2: Basler_30cm_2A_v2.png
|
 |
| Attachment 3: Basler_30cm_3A_v1.png
|
 |
| Attachment 4: Basler_30cm_3A_v2.png
|
 |
| Attachment 5: Basler_85cm_2A_v1.png
|
 |
| Attachment 6: Basler_85cm_2A_v2.png
|
 |
| Attachment 7: Basler_85cm_3A_v1.png
|
 |
| Attachment 8: Basler_85cm_3A_v2.png
|
 |
| Attachment 9: Screenshot_2019-12-19_4_151242.png
|
 |
|
44
|
Thu Dec 19 16:03:17 2019 |
Ronic Chiche | Fixed | info | lasers and optics | Optical room | Beam size behind M2 |
Yesterday, we tried to better adapt positions of the telescope lenses, dynamically, during the lock, to improve the matching between input beam and cavity mode.
it is a difficult task because it is quite sensitive to the alignment. we need to realign very often... and it is a long process.
at the end, we concluded that we need to move to much the lenses to be feasible, then we stopped.
then we tried also to change the cavity mode by moving the spherical mirrors inside the cavity but again, the telescope is too far from its expected parameters.
we need to make a cavity mode smaller at high power and we need to move too far the spherical mirrors, then we stopped also this trial.
the conclusion is we need to better measure the cavity mode and make a telescope better adapted to the "hot" cavity.
it is still strange to measure a tranmsission signal AND a coupling signal with a "thermal" decay at the beginning of the lock for both and we expect that they complementary and should vary in contrary direction.
very strange as we use very large PhD which should net be sensitive to misalignments.
| Ronic Chiche wrote: |
|
the telescope matchs the cold cavity beam, so it is normal to have a power decrease on the transmission photodiode when the cavity is heating at high power.
we can try to adjust the telescope by moving lens, one by one, to increase the cavity power.
| Ronic Chiche wrote: |
|
Beam diameter behind M2 :
- 2nd stage @ 6A - 1kW inside cavity
sx = 2120 µm
sy = 2150 µm
- 3rd stage @ 3A - 30kW inside cavity
sx = 2260 µm
sy = 2475 µm
|
|
|
|
42
|
Thu Dec 19 09:21:45 2019 |
Ronic Chiche | Fixed | info | lasers and optics | Optical room | Optical amplifier polarization state |
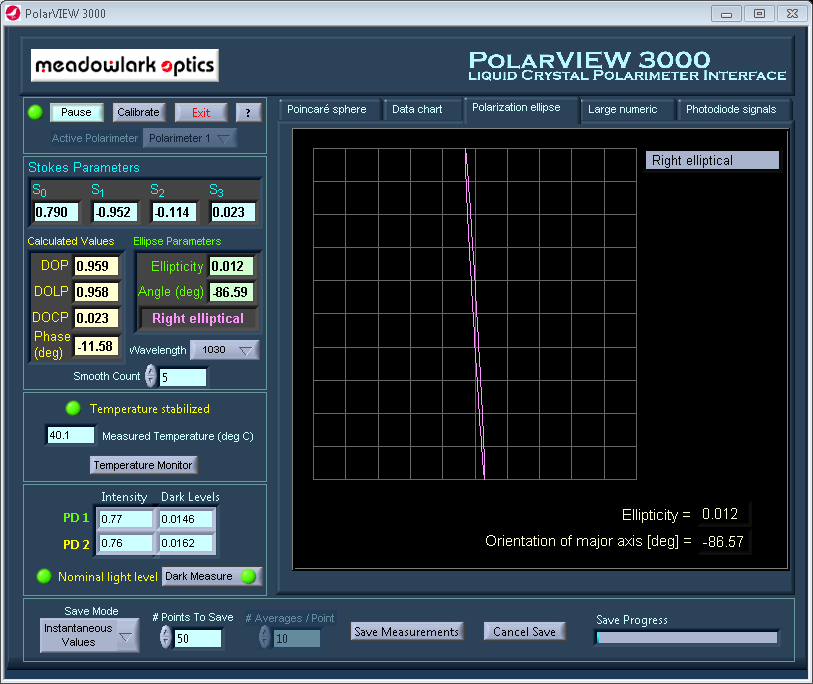
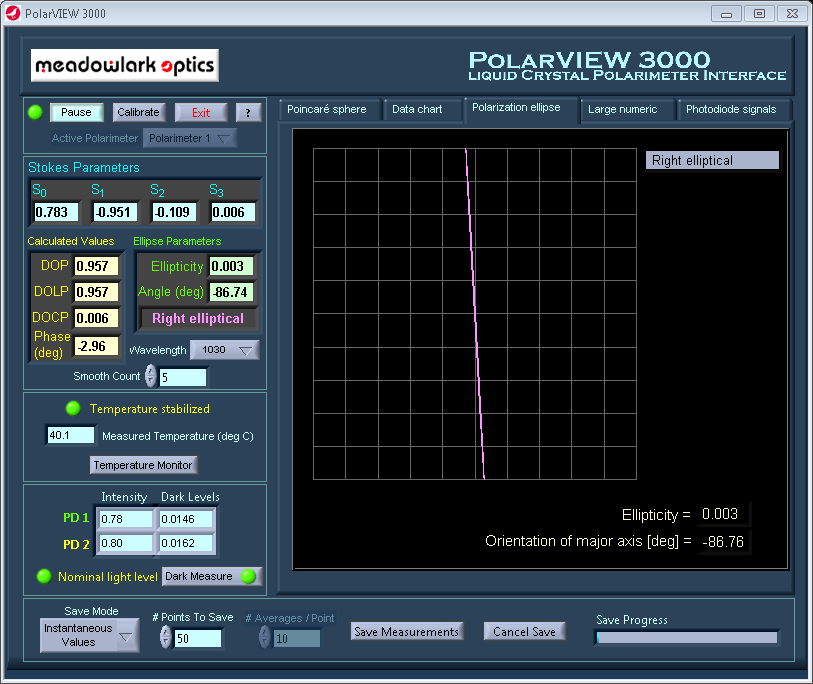
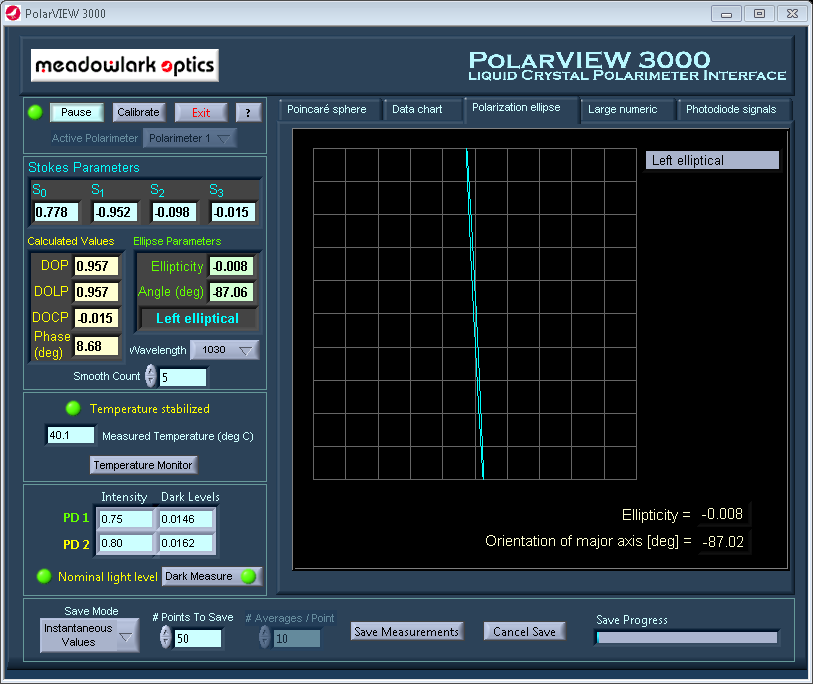
polarization state of the cavity at higher power : 20kW, 30kW and 33kW (slight CEP and alignment optimization) :
the polarization state changes only a little to ~ 87° and is almost linear.
| Ronic Chiche wrote: |
|
The polarimeter was giving a strange 50% of DOP of the light coming from the cavity.
we had to calibrate (LONG calibration process with care) the polarimeter to get a proper 100% of DOP !
the polarimeter needs also a good alignment with 2 mirrors, a colimated beam and a max power on photodiode between 0.7 and 0.8 (use electronic gain to adapt the level)
at low power (1.5kW inside cavity), the cavity is almost vertically polarized (89°).
| Ronic Chiche wrote: |
|
We placed a PBS + 2 photodiodes (PhD1, PhD2) at the output of the amplifier to check how the polarization of the amplifier changes with power.
example with 2nd stage @ 6A :
PhD1 = 24.7 mV
PhD2 = 8.9 mV
PhD1/PhD2 = 2.78
and with 3rd stage @ 2A :
PhD1 = 353 mV
PhD2 = 82.8 mV
PhD1/PhD2 = 4.26
Conclusion : we must adapt the quarter and half waveplates for each input power to be always matched with cavity polarization !!!
One could also study how the amplifier polarization changes during time and temperature.
|
|
|
| Attachment 1: cavity_polar_3e_etage_2A_-_20kW.PNG
|
 |
| Attachment 2: cavity_polar_3e_etage_3A_-_30kW.PNG
|
 |
| Attachment 3: cavity_polar_3e_etage_3A_-_33kW.PNG
|
 |
|
41
|
Tue Dec 17 17:58:12 2019 |
Ronic Chiche | Fixed | info | lasers and optics | Optical room | Beam size behind M2 |
the telescope matchs the cold cavity beam, so it is normal to have a power decrease on the transmission photodiode when the cavity is heating at high power.
we can try to adjust the telescope by moving lens, one by one, to increase the cavity power.
| Ronic Chiche wrote: |
|
Beam diameter behind M2 :
- 2nd stage @ 6A - 1kW inside cavity
sx = 2120 µm
sy = 2150 µm
- 3rd stage @ 3A - 30kW inside cavity
sx = 2260 µm
sy = 2475 µm
|
|
|
40
|
Tue Dec 17 17:54:38 2019 |
Ronic Chiche | Fixed | info | lasers and optics | Optical room | Optical amplifier polarization state |
The polarimeter was giving a strange 50% of DOP of the light coming from the cavity.
we had to calibrate (LONG calibration process with care) the polarimeter to get a proper 100% of DOP !
the polarimeter needs also a good alignment with 2 mirrors, a colimated beam and a max power on photodiode between 0.7 and 0.8 (use electronic gain to adapt the level)
at low power (1.5kW inside cavity), the cavity is almost vertically polarized (89°).
| Ronic Chiche wrote: |
|
We placed a PBS + 2 photodiodes (PhD1, PhD2) at the output of the amplifier to check how the polarization of the amplifier changes with power.
example with 2nd stage @ 6A :
PhD1 = 24.7 mV
PhD2 = 8.9 mV
PhD1/PhD2 = 2.78
and with 3rd stage @ 2A :
PhD1 = 353 mV
PhD2 = 82.8 mV
PhD1/PhD2 = 4.26
Conclusion : we must adapt the quarter and half waveplates for each input power to be always matched with cavity polarization !!!
One could also study how the amplifier polarization changes during time and temperature.
|
|
| Attachment 1: cavity_polar_2e_etage_1kW.PNG
|
 |
|
39
|
Tue Dec 17 12:16:54 2019 |
Ronic Chiche | Fixed | info | lasers and optics | Optical room | Optical amplifier polarization state |
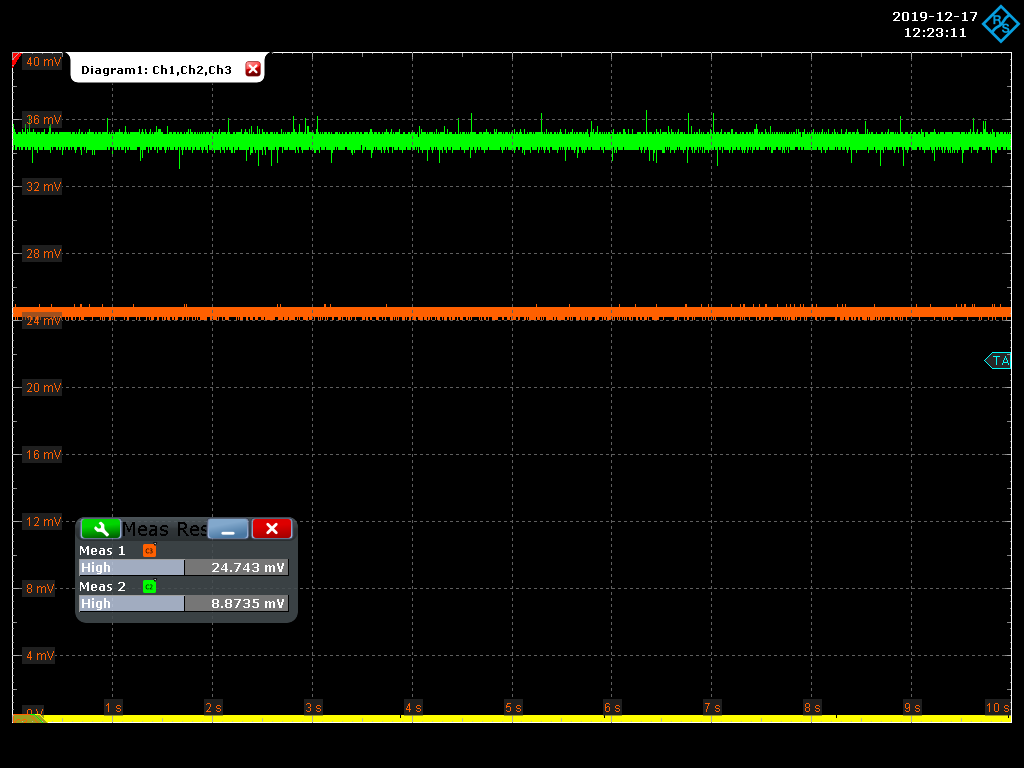
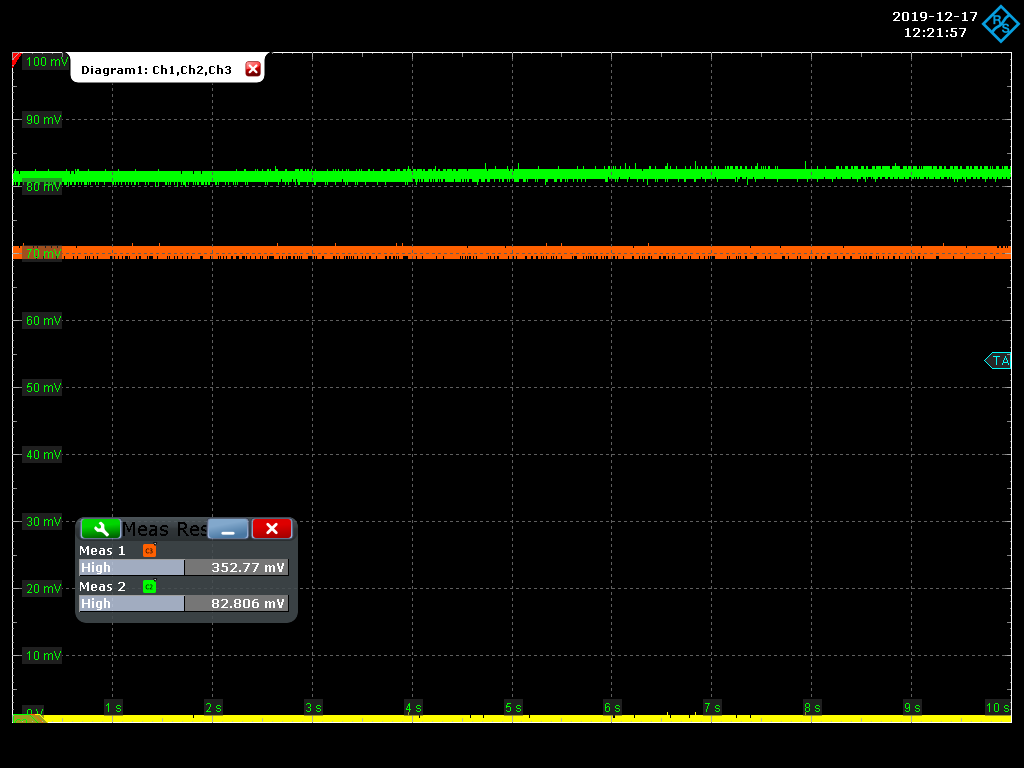
We placed a PBS + 2 photodiodes (PhD1, PhD2) at the output of the amplifier to check how the polarization of the amplifier changes with power.
example with 2nd stage @ 6A :
PhD1 = 24.7 mV
PhD2 = 8.9 mV
PhD1/PhD2 = 2.78
and with 3rd stage @ 2A :
PhD1 = 353 mV
PhD2 = 82.8 mV
PhD1/PhD2 = 4.26
Conclusion : we must adapt the quarter and half waveplates for each input power to be always matched with cavity polarization !!!
One could also study how the amplifier polarization changes during time and temperature. |
| Attachment 1: Screenshot_2019-12-17_8_122311.png
|
 |
| Attachment 2: Screenshot_2019-12-17_7_122157.png
|
 |
|
38
|
Tue Dec 17 10:56:08 2019 |
Ronic Chiche | Fixed | report | lasers and optics | Optical room | first data with 3A on the 3rd stage |
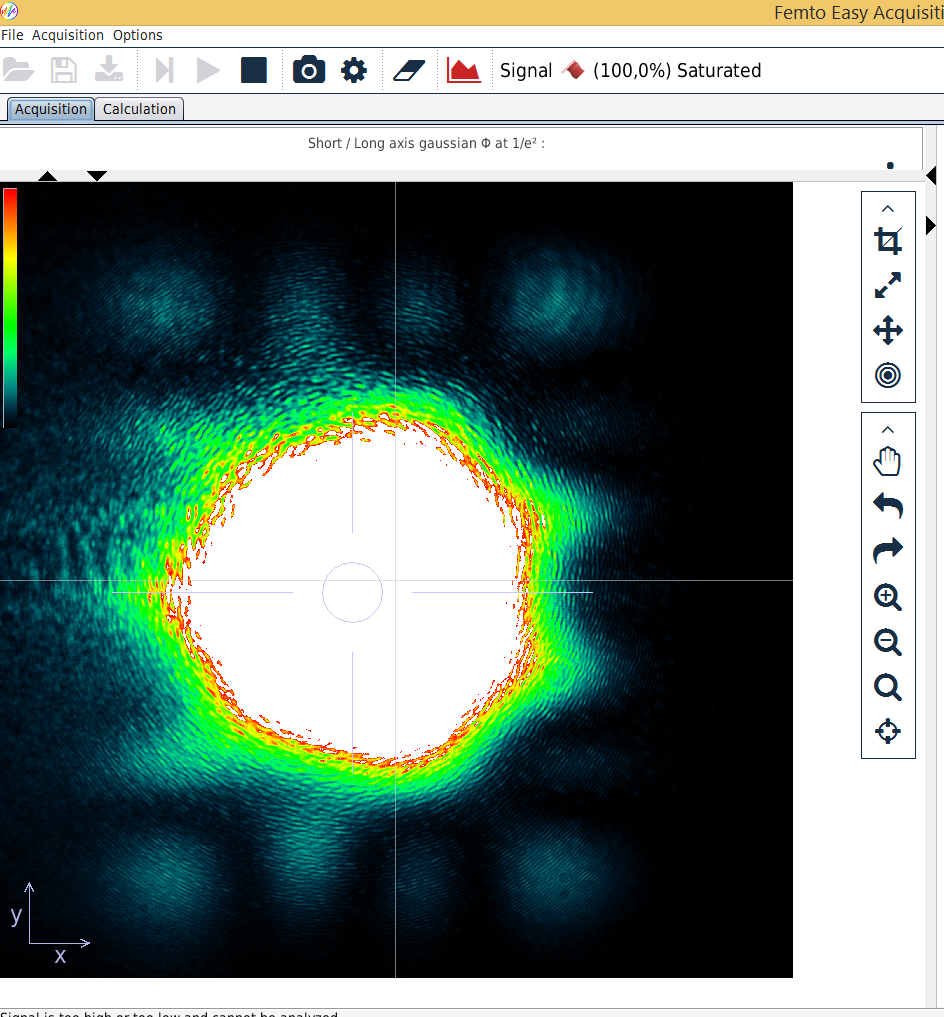
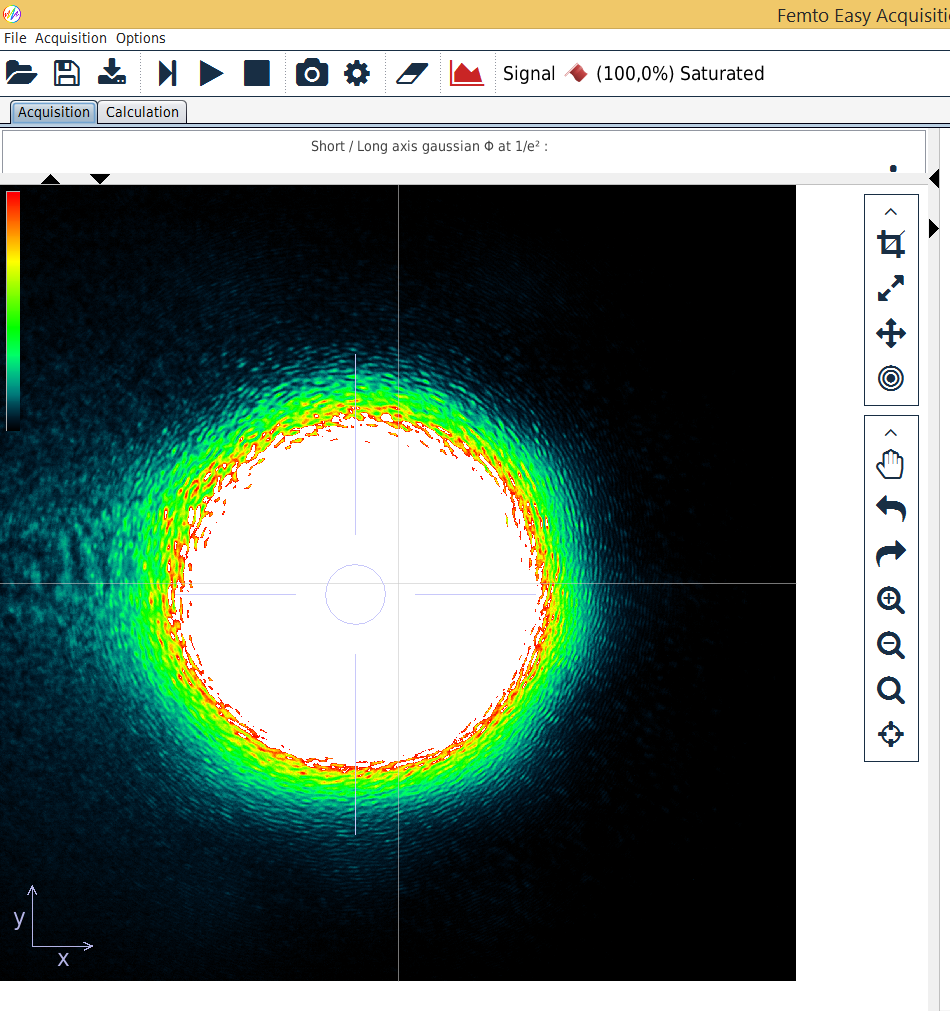
2 pictures :
typical beam with HOM
typical beam after moving the D-shape motor : no more HOM
| Ronic Chiche wrote: |
|
Today, at 3A on the 3rd stage, we saw some HOM effects.
the transmissions is about 100mW which corresponds to 30kW inside cavity.
we tried to play with D shape motors but without success.
on the plot below, a mix between Thermal effects andHOM effects (the trans step at 13s is done without any external action)
-yellow : transmission
- orange : coupling
- blue : PZT correction
the camera video does not correspond exactly to the scope plot.
it is just an example of HOM effect.
|
|
| Attachment 1: HOM_5-3_saturated.png
|
 |
| Attachment 2: fundamental_mode_saturated.png
|
 |
|
37
|
Tue Dec 17 10:46:24 2019 |
Ronic Chiche | Fixed | info | lasers and optics | Optical room | Beam size behind M2 |
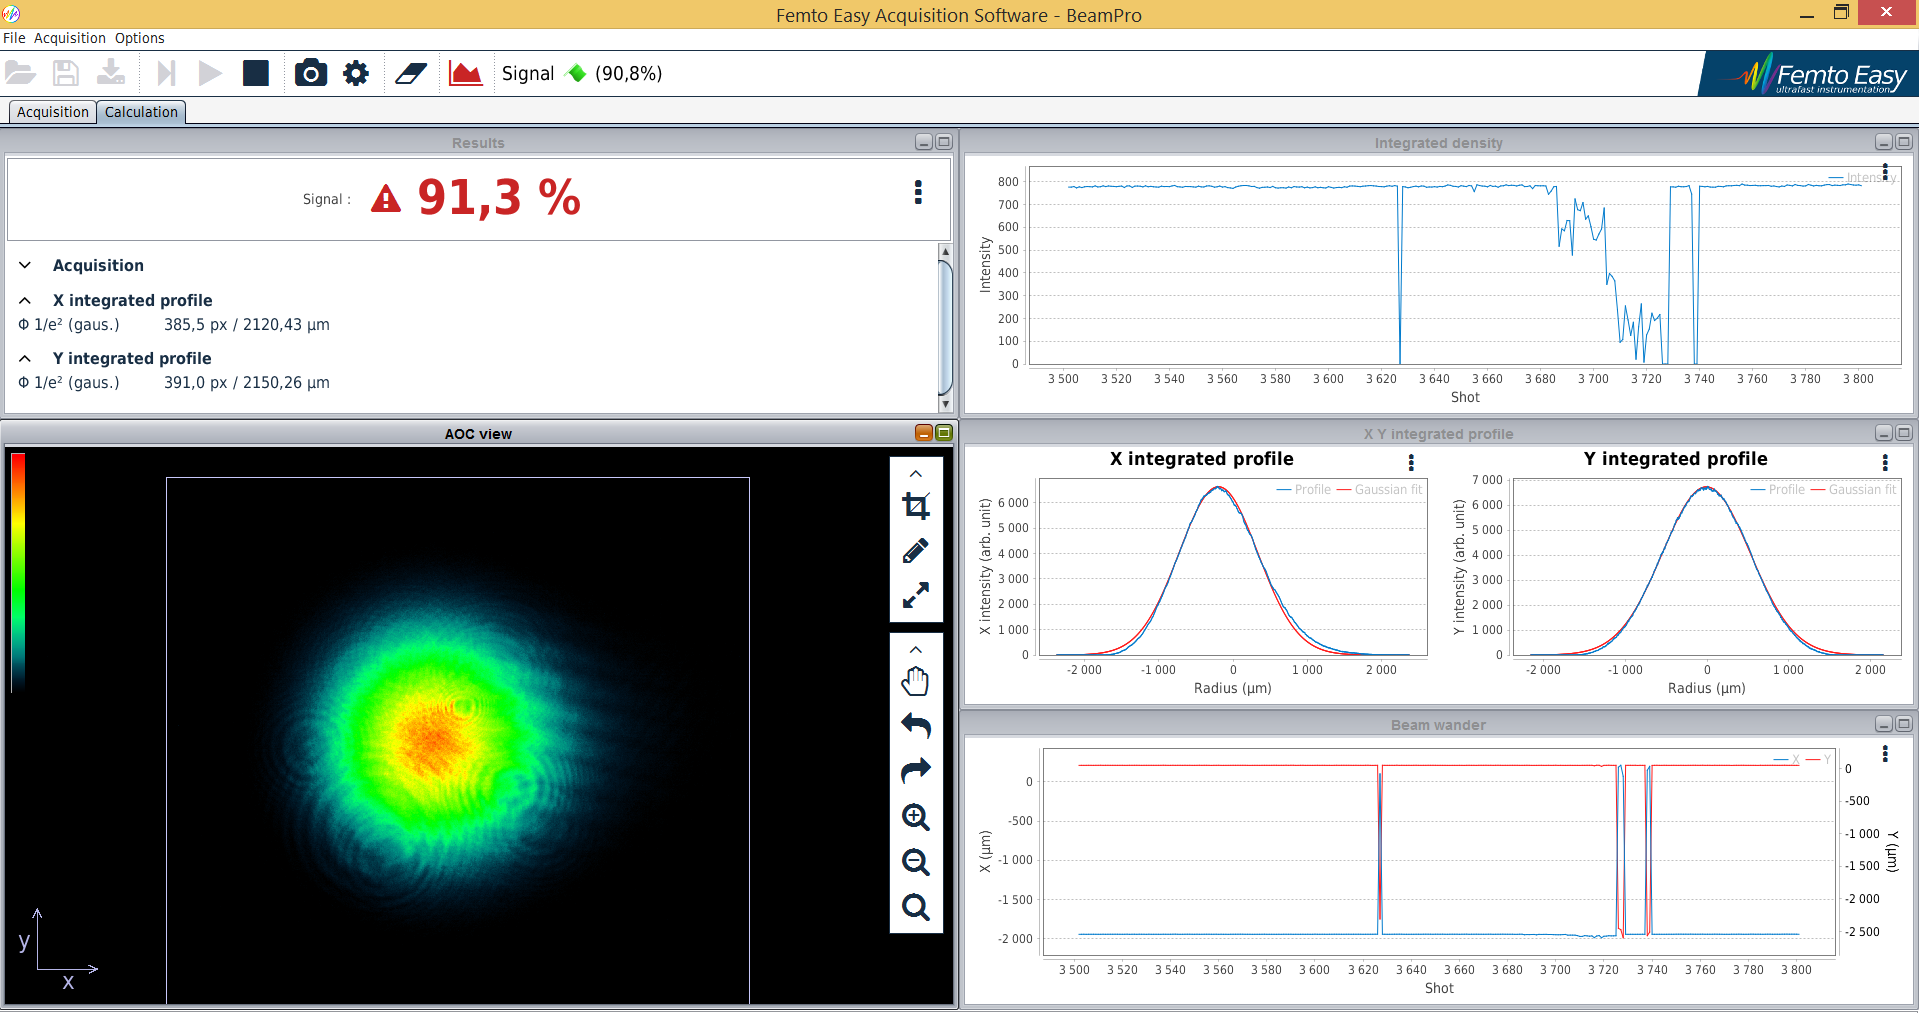
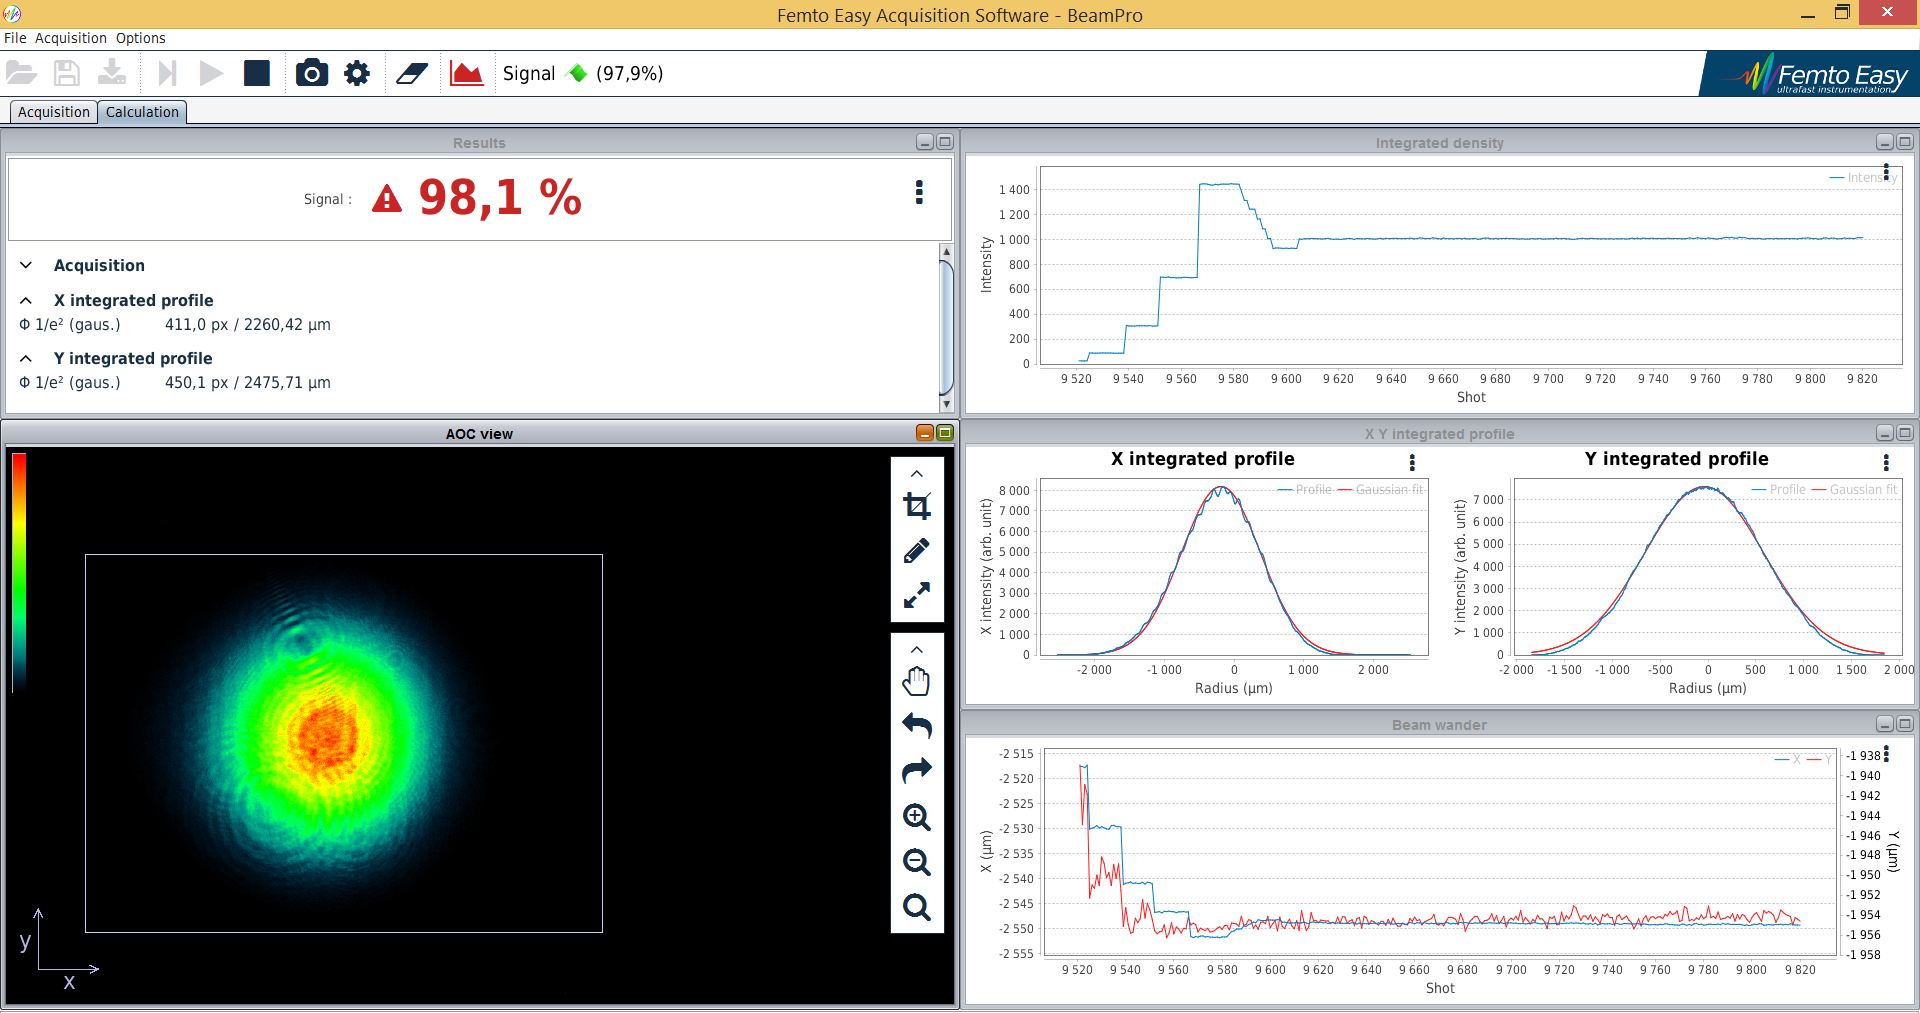
Beam diameter behind M2 :
- 2nd stage @ 6A - 1kW inside cavity
sx = 2120 µm
sy = 2150 µm
- 3rd stage @ 3A - 30kW inside cavity
sx = 2260 µm
sy = 2475 µm |
| Attachment 1: beam_diameter_behind_M2_-_1kW.png
|
 |
| Attachment 2: beam_diameter_behind_M2_-_30kW.png
|
 |
|
36
|
Fri Dec 13 18:28:00 2019 |
Ronic Chiche | Fixed | report | lasers and optics | Optical room | first data with 3A on the 3rd stage |
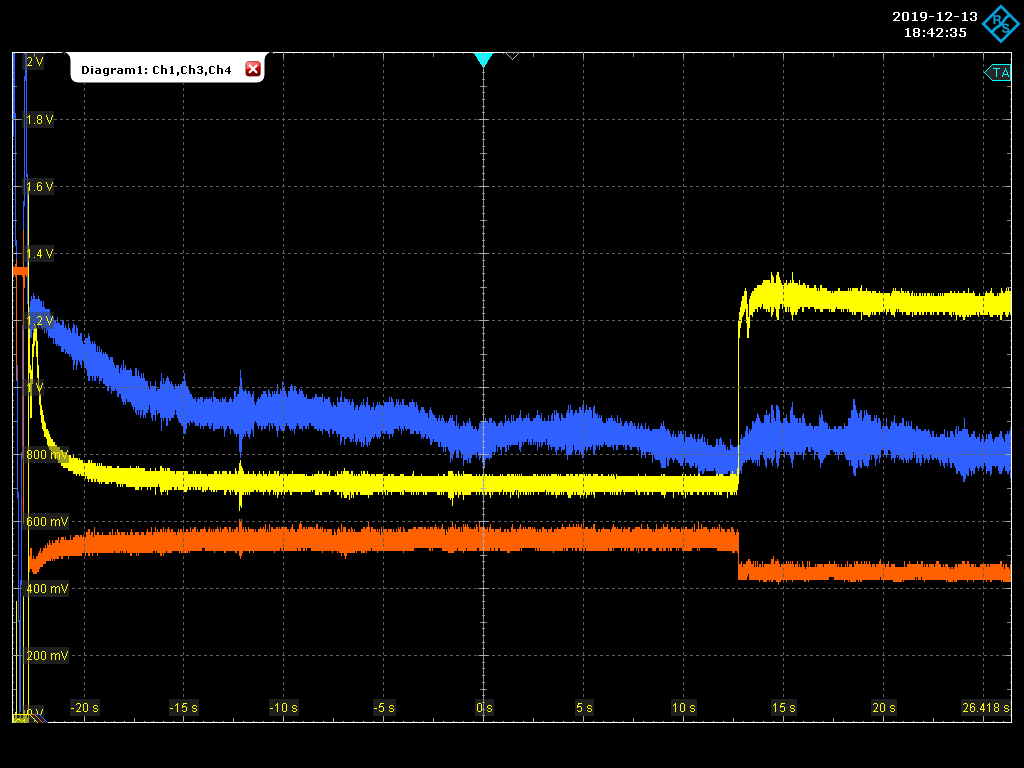
Today, at 3A on the 3rd stage, we saw some HOM effects.
the transmissions is about 100mW which corresponds to 30kW inside cavity.
we tried to play with D shape motors but without success.
on the plot below, a mix between Thermal effects andHOM effects (the trans step at 13s is done without any external action)
-yellow : transmission
- orange : coupling
- blue : PZT correction
the camera video does not correspond exactly to the scope plot.
it is just an example of HOM effect. |
| Attachment 1: Screenshot_2019-12-13_3_184235.png
|
 |
| Attachment 2: HOM.gif
|
 |
|
35
|
Fri Dec 13 15:56:22 2019 |
Ronic Chiche | Fixed | issue | lasers and optics | Optical room | 2nd stage amplifier issue |
2nd stage output power was going down. We checked the pump diode technical data sheet and the operating temperature is [25°C:35°C].
We increased the chiller temperature setpoint from 19°C to 23°C.
Then the output power increased (93mW on 2nd stage photodiode).
| Ronic Chiche wrote: |
|
Last time, we switched ON directly the 2nd stage at 6A without increasing/decrinsing slowly the current.
today, we switched ON the chiller, switched ON the 1st stage, switch ON the power supply of the 2nd stage at 0A and then we increased slowly the current until 6A... and the problem disappeared.
| ARonic Chiche wrote: |
|
the 2nd stage amplifier needed several hours (4-5h) to reach its nominal power (we look at photodiode level on a scope), instead of the awaited 30 minutes.
could it come from the probable spectrum shifting of the OneFive laser ?
(the power coming from the CVBG, coupled to the fiber, is lower than expected).
|
|
|
|
34
|
Thu Dec 12 11:49:05 2019 |
Ronic Chiche | Fixed | issue | lasers and optics | Optical room | 2nd stage amplifier issue |
Last time, we switched ON directly the 2nd stage at 6A without increasing/decrinsing slowly the current.
today, we switched ON the chiller, switched ON the 1st stage, switch ON the power supply of the 2nd stage at 0A and then we increased slowly the current until 6A... and the problem disappeared.
| ARonic Chiche wrote: |
|
the 2nd stage amplifier needed several hours (4-5h) to reach its nominal power (we look at photodiode level on a scope), instead of the awaited 30 minutes.
could it come from the probable spectrum shifting of the OneFive laser ?
(the power coming from the CVBG, coupled to the fiber, is lower than expected).
|
|
|
33
|
Wed Dec 11 17:13:02 2019 |
Ronic Chiche | Fixed | issue | lasers and optics | Optical room | 2nd stage amplifier issue |
the 2nd stage amplifier needed several hours (4-5h) to reach its nominal power (we look at photodiode level on a scope), instead of the awaited 30 minutes.
could it come from the probable spectrum shifting of the OneFive laser ?
(the power coming from the CVBG, coupled to the fiber, is lower than expected). |
|
32
|
Tue Dec 10 09:36:56 2019 |
Ronic Chiche | Fixed | info | lasers and optics | Optical room | FSR and Finesse measurement |
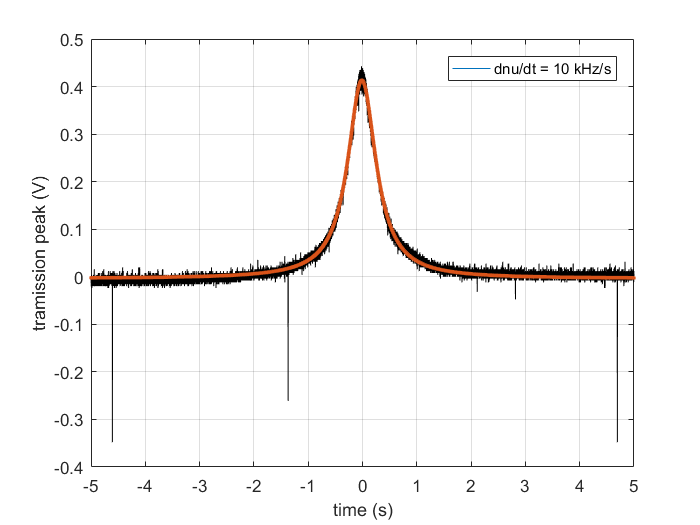
Yesterday the cavity has been aligned and locked with the CW Koheras laser.
the FSR has been measured by modulation technique at 133.344MHz at 1mbar pressure in the cavity.
the polarization has to be optimized for the Finesse measurement otherwise, some "shoulders" appear beside the Airy peak and reduce Finesse fit.
once it is done, 3 consecutive measurements give an average Finesse of 20800. |
| Attachment 1: untitled.png
|
 |
|
31
|
Fri Dec 6 11:54:58 2019 |
Loïc Amoudry | Fixed | report | lasers and optics | Optical room | Mirror's installed |
The initial 400kW SBOX mirrors which have been cleaned ont 28th of november have been installed this morning on the SBOX. |
|
30
|
Fri Dec 6 11:53:53 2019 |
Loïc Amoudry | Fixed | report | lasers and optics | Optical room | Mirror's cleaning |
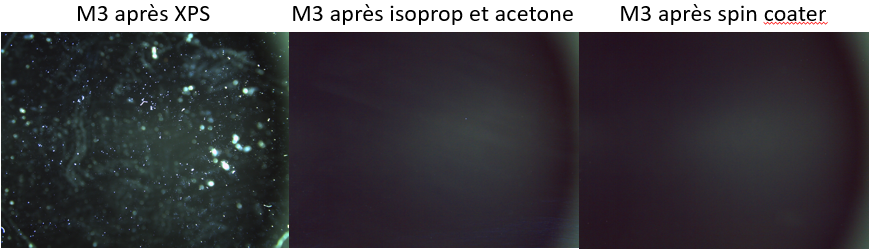
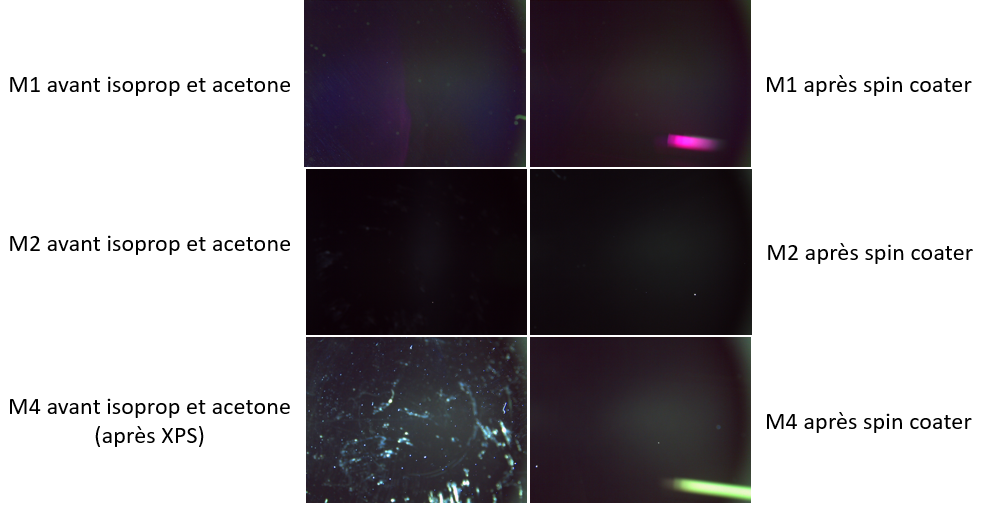
XPS has been proceeded on the 400kW SBOX mirrors M3 and M4 (the initial cavity spherical mirrors) in frebruary 2019. Deposited a lot of particles on these mirrors.
All the mirrors received a Infrared spectroscopy the 12th of november 2019. Deposited glue on the non-reflective face (was used to hold them).
15th of november (2019): The four 400kW SBOX mirror's have been cleaned with aceton and isopropanol.
28th of november (2019): The four 400kW SBOX mirror's have been cleaned with spin coater.
Summary:
Aceton and isopropanol removed most of the particles and all the glue. But it let some traces on the mirror surface on all the mirrors (so there is some kind of grease on the surfaces).
Spin coater removes all the traces.
See pictures. On all the first images, we also see the dust which is on the non reflective face through the mirror. On M3 and M4 there is still the "glue" on the non reflective face on their frst images + refletive faces very dirty because of XPS. |
| Attachment 1: resume_M3.PNG
|
 |
| Attachment 2: resume_M1_M2_M4.PNG
|
 |