ID |
Date |
Author |
Status |
Type |
Category |
Location |
Title |
|
212
|
Mon Apr 8 08:34:54 2024 |
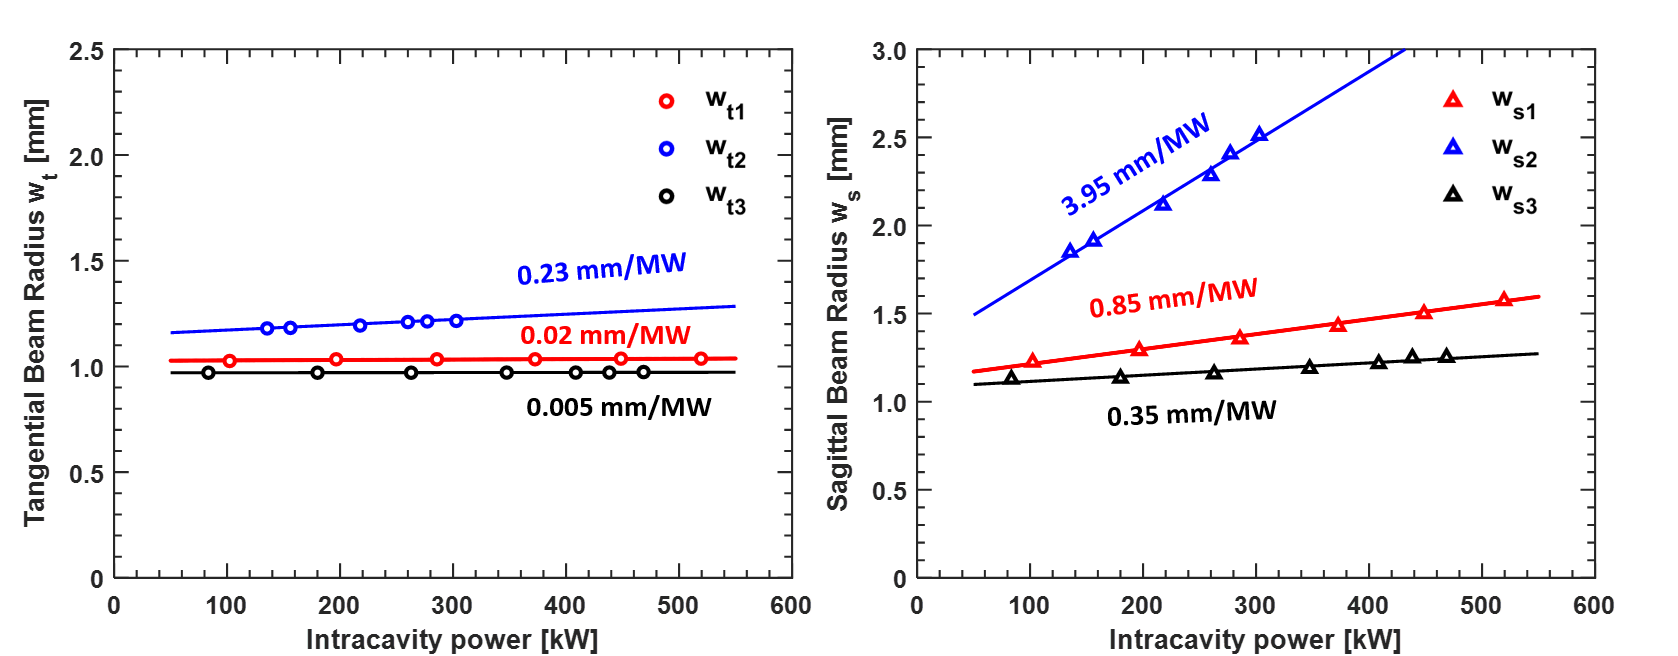
Xinyi Lu | Fixed | info | lasers and optics | Optical room | Different cavity modes & Pulse width | - Last week, we obtained three curves of the variation of different cavity modes with power (Fig. 1). By comparing the gain for similar cavity mode sizes, we found that the gain always drops with increasing power.
- We measured the pulse width. The pulse width of the seed laser, after CVBG, amplified at 2A was measured by UPD (rise time < 70ps). Code filtering was performed by comparing the data to reduce the effect of rise time. The final result was t= 186 ps after CVBG and t=162 ps for the amplified at 2A.
- Today we will measure finesse using CW laser.
| Xinyi Lu wrote: |
|
- We re-measured the gain before moving the mirror. Gain ~9000 was achieved at 3A, but as the power increased, the gain dropped and was difficult to optimize. In fact, we found that each day the gain was a little higher than the previous day.
| Amp current (A) |
Injection power (W) |
Circulating power (kW) |
Gain(coupling~0.7) |
Finesse |
| 3 |
23.5 |
213 |
9046 |
33595 |
| 4 |
35.5 |
309 |
8692 |
32933 |
| 5 |
47 |
390 |
8292 |
32165 |
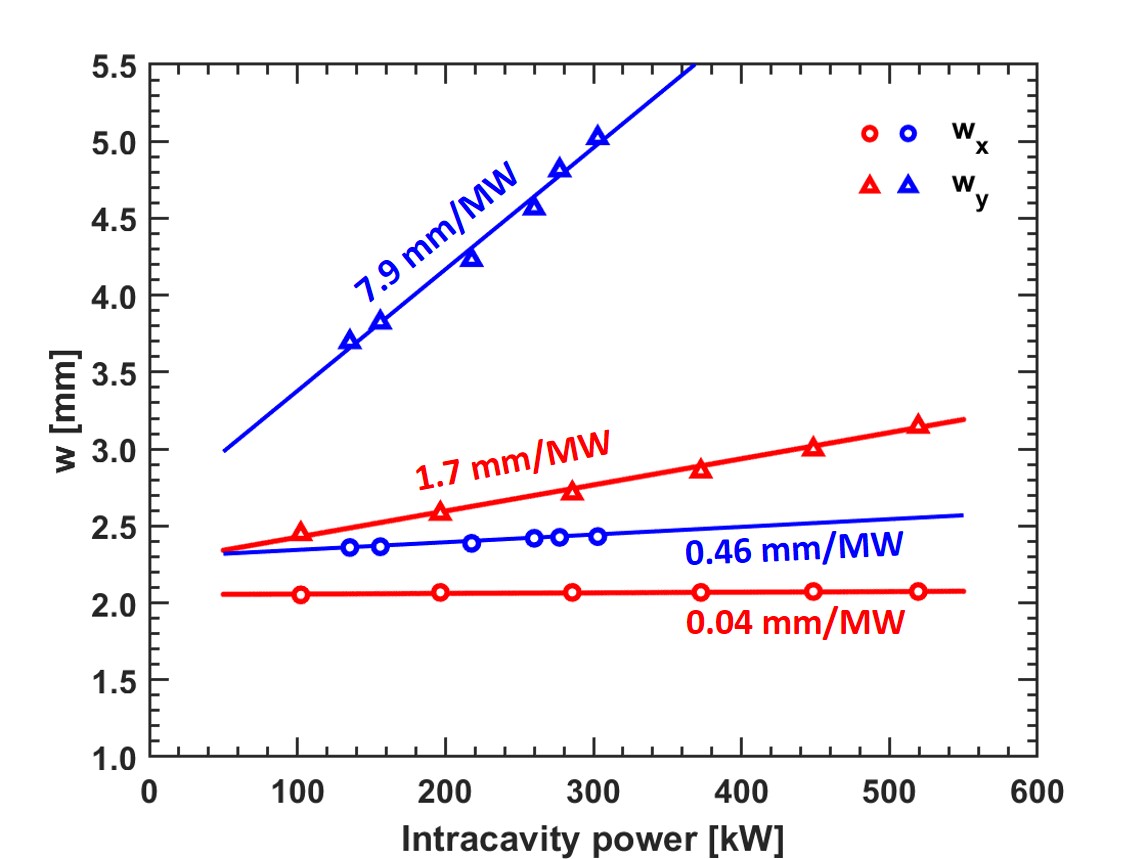
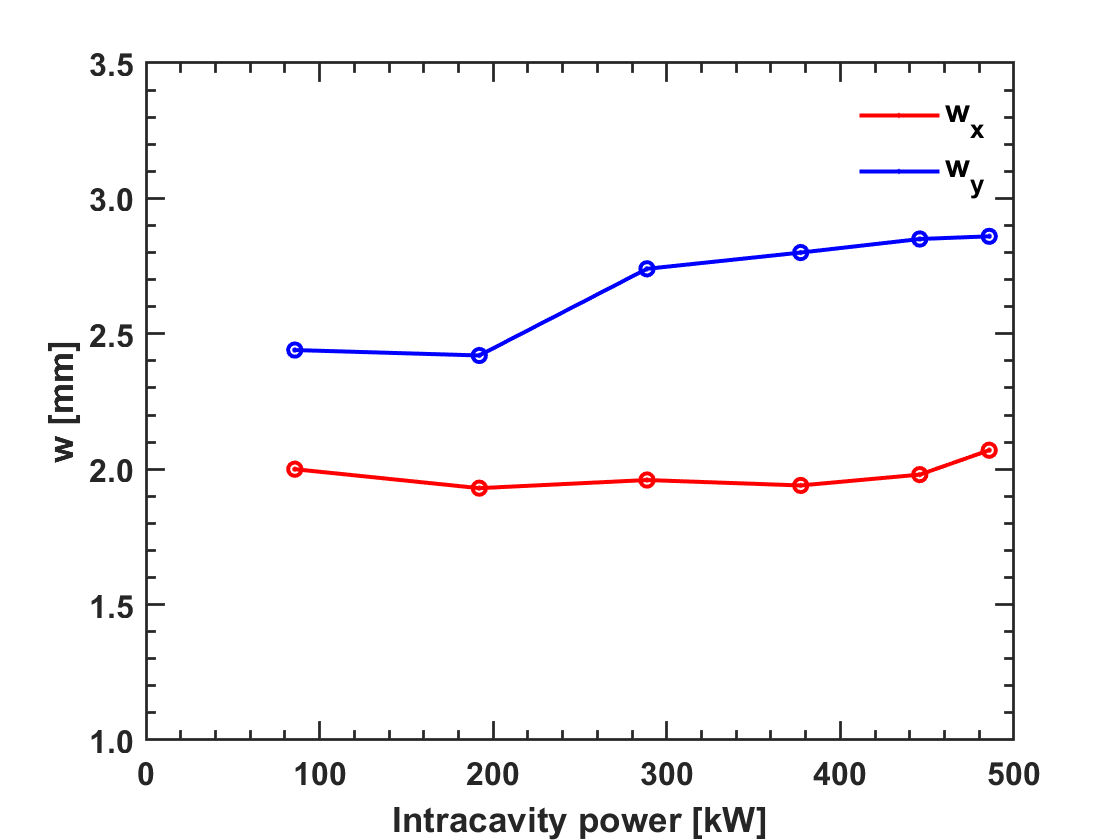
- We then moved the M3 spherical mirror 1.7mm to make the beam size larger and measured the variation in cavity mode size at different powers. (Figure 1, red is the original result and blue is the result for a larger cavity mode). It is clear that the larger the cavity mode, the larger the slope. The new slope of w_y is 7.9mm/MW. Tomorrow we will make the cavity mode smaller (like in Carstens' paper) and compare the three curves.
- It is not simple to compare the gain variations of different cavity modes because it takes more time to optimize the telescope and alignment. Ronic suggested that we could compensate for the cavity mode variation by moving the spherical mirror to see how the gain changes at different powers while keeping the cavity mode unchanged.
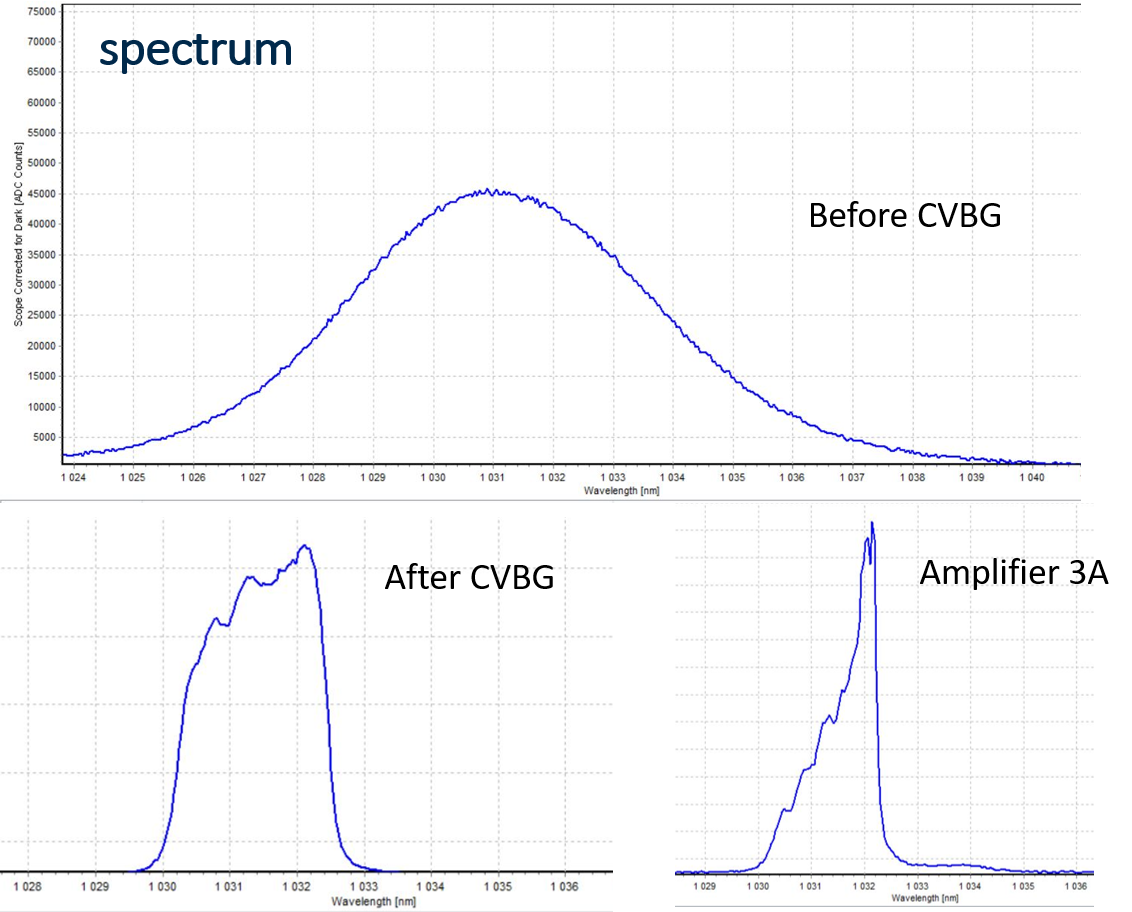
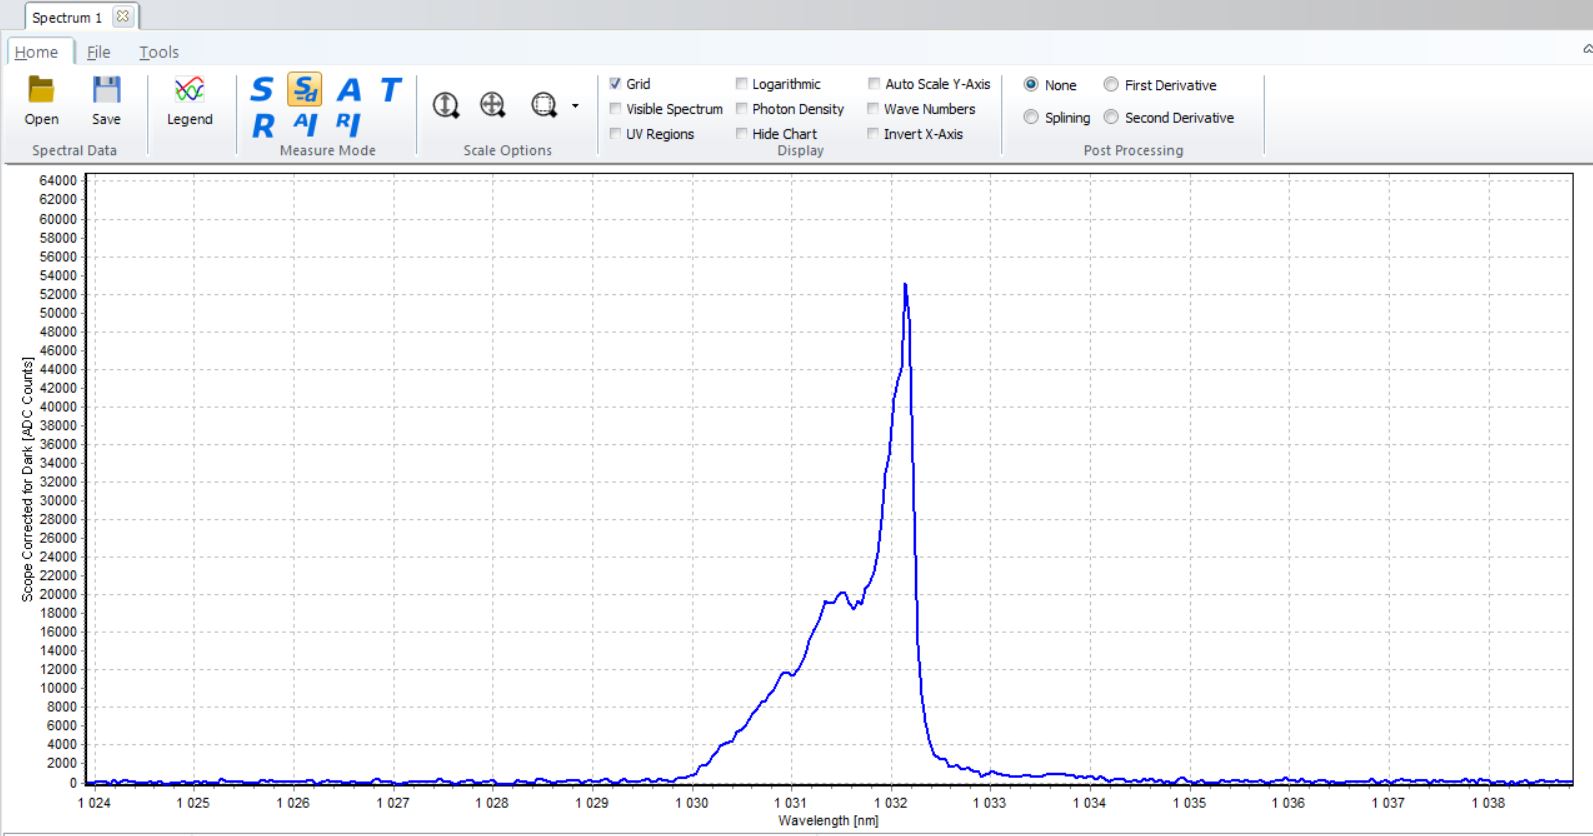
- In addition, we measured the spectrum of the menhir laser, after cvgb, amplifier output at 3A (Figure 2). We found that the peak changed from 1031 nm to 1032 nm after CVBG, probably because of the imperfect alignment of CVBG.
| Xinyi Lu wrote: |
|
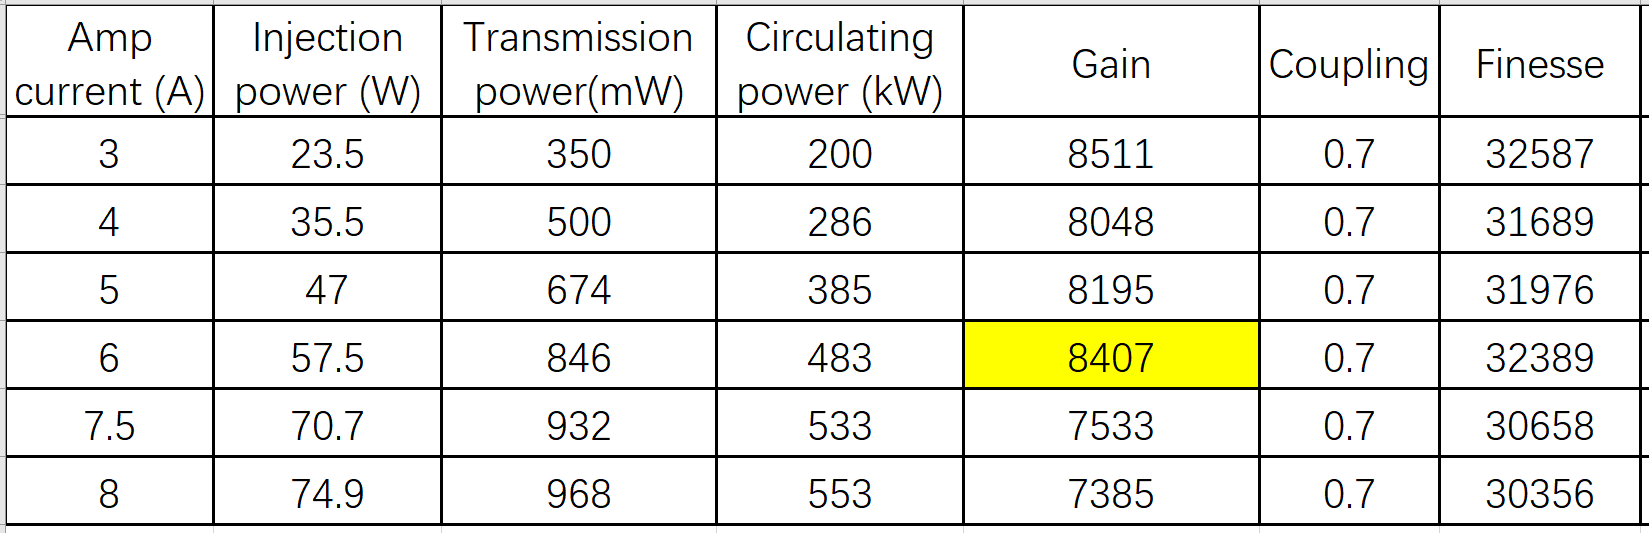
- Today we moved the position of the D-shaped mirror at 6A. When motor1 (vertical) is 0.2mm away from the spot, the power in the cavity rises from 457kW to 483kW. Gain=8407 is similar to that at low power (Gain=8511). So the D-shaped mirror lost some of the gain in the previous experiments. At 4A and 5A we did not move the D-shaped mirror. (Figure 1)
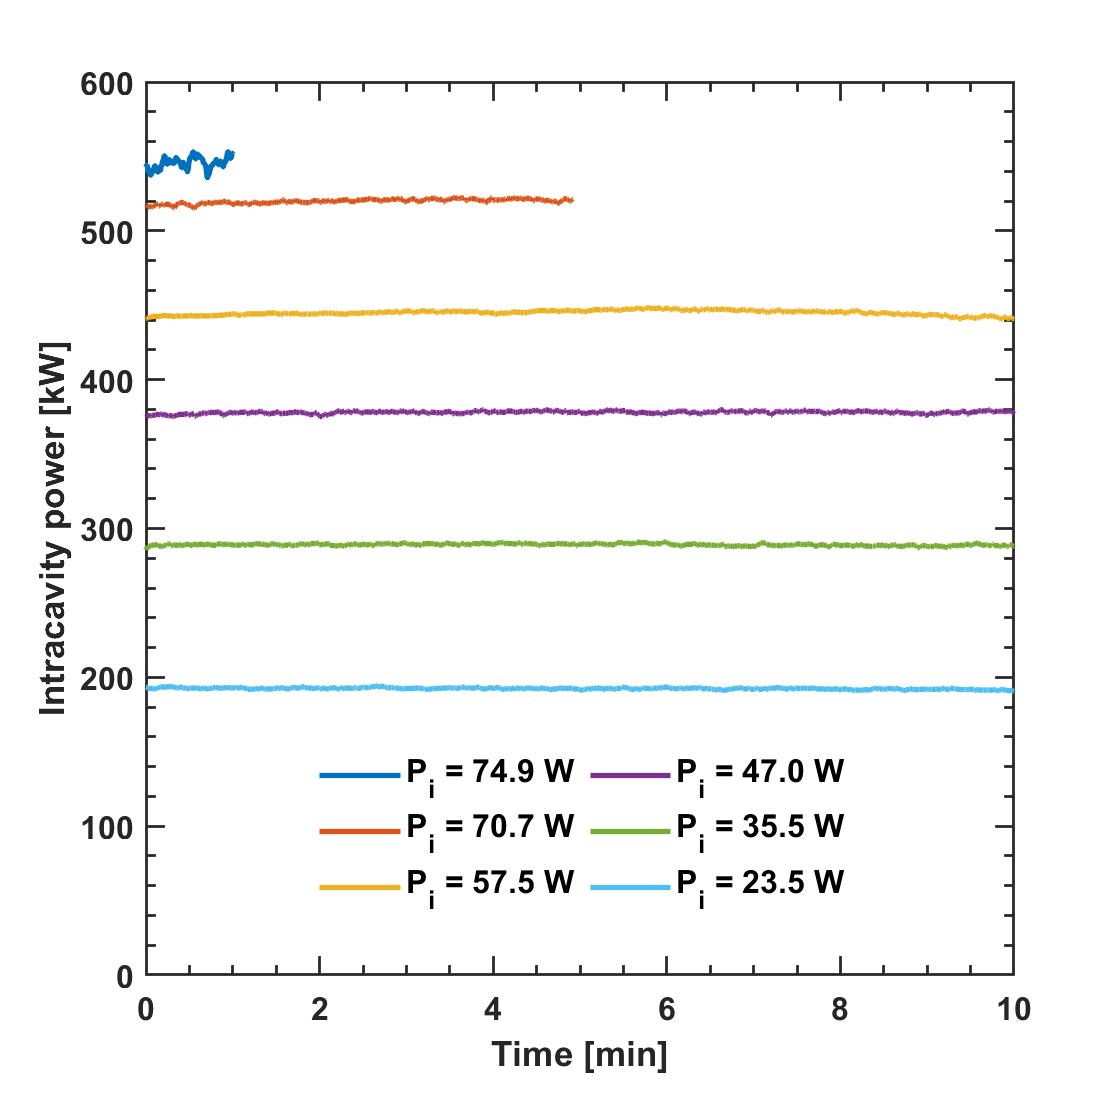
- At 8A, we got 553 kW inside the cavity for one minute (Figure 2). The pump temperature is higher than yesterday (up to 34°C).
- At 7.5A and 8A, the cavity can remain stably locked, but the power fluctuation in the cavity is so large that it is difficult to optimize the alignment. This may be due to the short time the amplifier was on, the pump temperature, amplifier pointing and power fluctuations, and thermal effects in the cavity....... The amplifier operated differently at different moments.
- We measured the spectrum of the amplified laser. (Figure 3) The peak is 1032.2 nm. We will optimize the alignment and increase the power to optimize this measurement.
- Next arrangement
Thursday: larger laser beam size
Friday: smaller laser beam size
Monday: finesse measurement with CW laser (Firstly check the possibility of measuring with pulsed laser)
| Xinyi Lu wrote: |
|
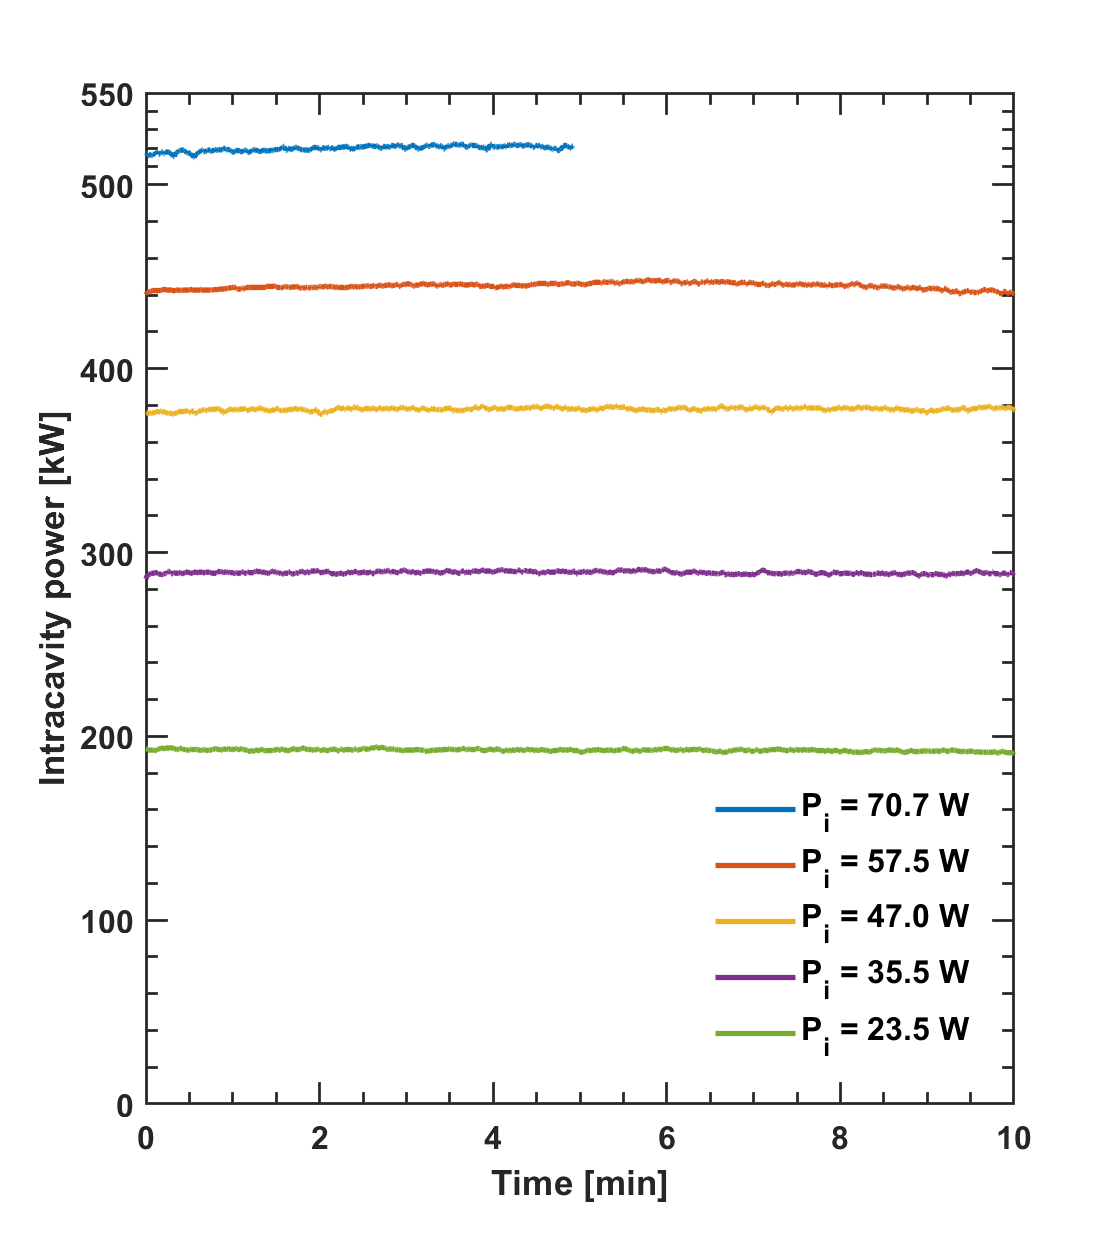
Yesterday, Ronic, Xing, Qili and I achieved a more stable 520kW power at 7.5A (71W injection) by optimizing the alignment and locking parameters. (Figure 1)
- The cavity can be stable locked when airflow is on. At 7.5A, the pump temperature is about 28℃. The chiller temperature didn't change, to the same 23 ℃ setting. We can try 8A later (75W injection) for a short time;
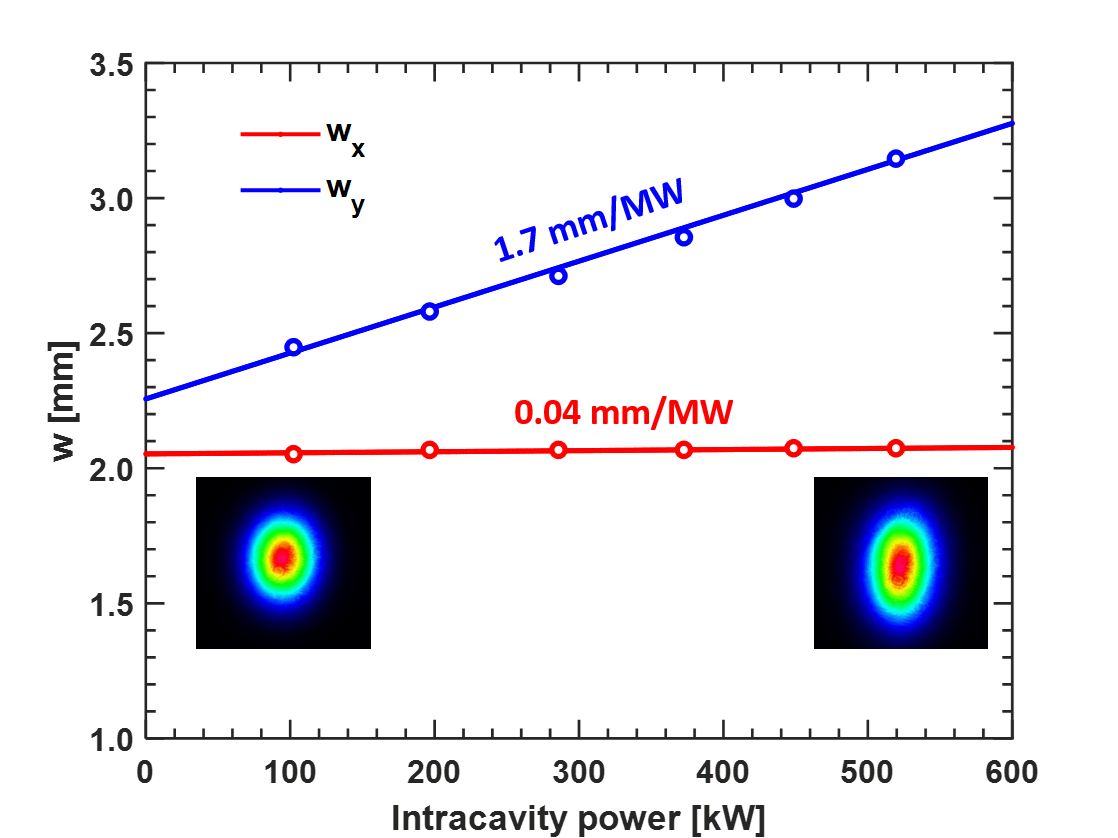
- Figure 2 demonstrates the cavity mode variation, wy/Pc ~ 1.7 mm/MW, half that of the OL paper (3.3 mm/MW). The thermal deformation of our device is much smaller.
- The experimental data are shown in Figure 3. Figure 4 shows the injection power vs circulating power.
- There are some tests that can be done at the moment. I'll update on the elog after discussing the necessity today. ^_^
|
|
|
|
| Attachment 1: cavitymode_vs_power_f.png
|  |
| Attachment 2: different_cavity_mode_data.xlsx
|
|
211
|
Thu Apr 4 21:48:16 2024 |
Xinyi Lu | Fixed | info | lasers and optics | Optical room | Larger beam size & Spectrum | - We re-measured the gain before moving the mirror. Gain ~9000 was achieved at 3A, but as the power increased, the gain dropped and was difficult to optimize. In fact, we found that each day the gain was a little higher than the previous day.
| Amp current (A) |
Injection power (W) |
Circulating power (kW) |
Gain(coupling~0.7) |
Finesse |
| 3 |
23.5 |
213 |
9046 |
33595 |
| 4 |
35.5 |
309 |
8692 |
32933 |
| 5 |
47 |
390 |
8292 |
32165 |
- We then moved the M3 spherical mirror 1.7mm to make the beam size larger and measured the variation in cavity mode size at different powers. (Figure 1, red is the original result and blue is the result for a larger cavity mode). It is clear that the larger the cavity mode, the larger the slope. The new slope of w_y is 7.9mm/MW. Tomorrow we will make the cavity mode smaller (like in Carstens' paper) and compare the three curves.
- It is not simple to compare the gain variations of different cavity modes because it takes more time to optimize the telescope and alignment. Ronic suggested that we could compensate for the cavity mode variation by moving the spherical mirror to see how the gain changes at different powers while keeping the cavity mode unchanged.
- In addition, we measured the spectrum of the menhir laser, after cvgb, amplifier output at 3A (Figure 2). We found that the peak changed from 1031 nm to 1032 nm after CVBG, probably because of the imperfect alignment of CVBG.
| Xinyi Lu wrote: |
|
- Today we moved the position of the D-shaped mirror at 6A. When motor1 (vertical) is 0.2mm away from the spot, the power in the cavity rises from 457kW to 483kW. Gain=8407 is similar to that at low power (Gain=8511). So the D-shaped mirror lost some of the gain in the previous experiments. At 4A and 5A we did not move the D-shaped mirror. (Figure 1)
- At 8A, we got 553 kW inside the cavity for one minute (Figure 2). The pump temperature is higher than yesterday (up to 34°C).
- At 7.5A and 8A, the cavity can remain stably locked, but the power fluctuation in the cavity is so large that it is difficult to optimize the alignment. This may be due to the short time the amplifier was on, the pump temperature, amplifier pointing and power fluctuations, and thermal effects in the cavity....... The amplifier operated differently at different moments.
- We measured the spectrum of the amplified laser. (Figure 3) The peak is 1032.2 nm. We will optimize the alignment and increase the power to optimize this measurement.
- Next arrangement
Thursday: larger laser beam size
Friday: smaller laser beam size
Monday: finesse measurement with CW laser (Firstly check the possibility of measuring with pulsed laser)
| Xinyi Lu wrote: |
|
Yesterday, Ronic, Xing, Qili and I achieved a more stable 520kW power at 7.5A (71W injection) by optimizing the alignment and locking parameters. (Figure 1)
- The cavity can be stable locked when airflow is on. At 7.5A, the pump temperature is about 28℃. The chiller temperature didn't change, to the same 23 ℃ setting. We can try 8A later (75W injection) for a short time;
- Figure 2 demonstrates the cavity mode variation, wy/Pc ~ 1.7 mm/MW, half that of the OL paper (3.3 mm/MW). The thermal deformation of our device is much smaller.
- The experimental data are shown in Figure 3. Figure 4 shows the injection power vs circulating power.
- There are some tests that can be done at the moment. I'll update on the elog after discussing the necessity today. ^_^
|
|
|
| Attachment 1: cavitymode_vs_power_bigger.jpg
|  |
| Attachment 2: spectrum.png
|  |
|
210
|
Wed Apr 3 21:37:07 2024 |
Xinyi Lu | Fixed | info | lasers and optics | Optical room | High power experiments (550kW) | - Today we moved the position of the D-shaped mirror at 6A. When motor1 (vertical) is 0.2mm away from the spot, the power in the cavity rises from 457kW to 483kW. Gain=8407 is similar to that at low power (Gain=8511). So the D-shaped mirror lost some of the gain in the previous experiments. At 4A and 5A we did not move the D-shaped mirror. (Figure 1)
- At 8A, we got 553 kW inside the cavity for one minute (Figure 2). The pump temperature is higher than yesterday (up to 34°C).
- At 7.5A and 8A, the cavity can remain stably locked, but the power fluctuation in the cavity is so large that it is difficult to optimize the alignment. This may be due to the short time the amplifier was on, the pump temperature, amplifier pointing and power fluctuations, and thermal effects in the cavity....... The amplifier operated differently at different moments.
- We measured the spectrum of the amplified laser. (Figure 3) The peak is 1032.2 nm. We will optimize the alignment and increase the power to optimize this measurement.
- Next arrangement
Thursday: larger laser beam size
Friday: smaller laser beam size
Monday: finesse measurement with CW laser (Firstly check the possibility of measuring with pulsed laser)
| Xinyi Lu wrote: |
|
Yesterday, Ronic, Xing, Qili and I achieved a more stable 520kW power at 7.5A (71W injection) by optimizing the alignment and locking parameters. (Figure 1)
- The cavity can be stable locked when airflow is on. At 7.5A, the pump temperature is about 28℃. The chiller temperature didn't change, to the same 23 ℃ setting. We can try 8A later (75W injection) for a short time;
- Figure 2 demonstrates the cavity mode variation, wy/Pc ~ 1.7 mm/MW, half that of the OL paper (3.3 mm/MW). The thermal deformation of our device is much smaller.
- The experimental data are shown in Figure 3. Figure 4 shows the injection power vs circulating power.
- There are some tests that can be done at the moment. I'll update on the elog after discussing the necessity today. ^_^
| Xinyi Lu wrote: |
|
Last week, we achieved a stable intracavity average power of 500kW, limited by amplifier power. The experimental data are shown in Figure 1.
- We measured the transmitted laser with a power meter in the windows behind M2 and M4 respectively, and the results were consistent, so the measurements were credible.
- There is only one transmitted laser spot behind both M2 and M4.
- We measured 10-minute locking data at different powers (Figure 2). 480 kW data was not optimized, and we will add 500 kW locking data later.
- We compared cavity modes at different powers (Figure 3). There are fluctuations because we only saved one data at one power. More data will be collected for averaging later.
- After finishing the high-power experiments, we will measure the finesse and the transmission of the mirrors used. As well as the pulse duration, spectrum, phase noise, and repetition rate of the laser.
| Xinyi Lu wrote: |
|
Today, Ronic, Daniele, Aurélien and I measured the amplifier power and mirror transmission.
| Current (A) |
0 (2rd stage) |
1 |
2 |
3 |
4 |
5 |
6 |
7 |
7.5 |
8 |
| Power (W) |
1 |
1.8 |
11.8 |
23.5 |
35.5 |
47 |
57.5 |
66.9 |
70.7 |
74.9 |
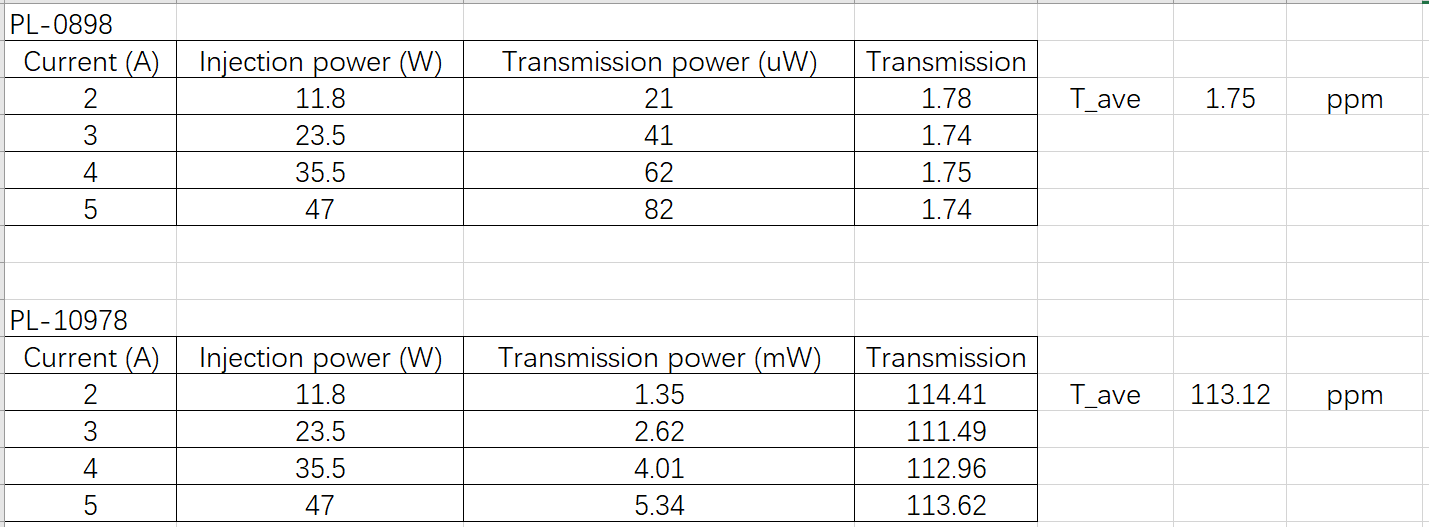
For transmission measurements, we used the same new mirrors as Sbox and ThomX, and installed an iris and a 2-inch mount to block the scattering laser.
The angle of incidence during the measurement was about 0.5°. We changed the angle and the measurements remained the same.
| Mirror Number |
PL-0898 |
PL-10978 |
| Nominal Value |
3 ppm |
115 ppm |
| Measured Value |
1.75 ppm |
113 ppm |
If the mirror being used also has a transmission of 1.75 ppm, the original 270kW is actually 463kW!!! The gain is 6549 and the finesse is 28585 (70% coupling).
We will do more tests to check it.
- Redo the experiment and check the spot behind the window at high power.
- Move the power meter to the plane mirror M2 window. It was previously behind the curved mirror M4 window.
- Compare locking curves, cavity mode sizes, and coupling efficiency at different powers.
- After finishing the high-power experiments, we will measure the finesse using CW laser and the transmission of the mirrors used.
| Xinyi Lu wrote: |
|
Today, Ronic and I achieved 272kW inside the cavity at 7.5A. The coupling maintained 60%-70%.
| Amp current (A) |
Injection power (W) |
Circulating power (kW) |
Gain |
| 2 |
10 |
50 |
5000 |
| 3 |
22 |
105 |
4773 |
| 4 |
34 |
156 |
4588 |
| 5 |
47 |
210 |
4468 |
| 6 |
58(Estimated) |
250 |
4310 |
| 7.5 |
76(Estimated) |
272 |
3579 |
- Compared to yesterday's experiment, we moved the position of the D-shaped mirrors farther in two directions to make the higher-order modes just disappear.
- Possible reasons for higher gain: D-shaped mirrors position, high power and pump vacuum cleaned cavity mirrors so that improve the finesse.
- We didn't see the strange drops like yesterday (Figure 1). However, in the window behind the M3, we can see 3 spots correlating with the intracavity power, even though moving the D-shaped very far does not make them disappear, only weakens them. We don't know where they came from. When this round of experiments is over, we can open the cavity and observe the optical paths.
- Next steps:
- Repeat the experiment to ensure that the gain does not drop.
- Long-term measurement at maximum power when the amplifier temperature is safe.
- Measure the transmittance of the cavity mirrors and the amplifier power.
- Open the cavity and observe the optical paths and the mirror surface.
| Xinyi Lu wrote: |
|
all the injection power in the chart have not been measured recently but during the Loic thesis period.
and these old measurements stopped at 5.5A of pump current.... so, the data at "8A" is a pure estimation.
about the last measurement :
it was made at 6A/8A/8A/8A for the 4 pump diodes of the amplifier (because 1st stage has a Peltier issue and we cannot check its temperature), so the average current is 7.5A instead of 8A.
and the linear scale between pump current and amplifier power is ~ 12W/A, then the estimated amplifier power for the last measurement is 76W instead of 87W
and the estimated gain is more 2658.
for this current, the amplifier works out of its nominal limits (temperature set at 25°C but measured at 30°C !!!) and the fans of the crate are making noise like hell.
so the last gain estimation should be treated very cautiously.
about the transmission and reflection signals behavior, one can write :
R + T + L = 1 => energy conservation for the cavity.
dR + dT + dL = 0 => dL = - (dR + dT)
if dX = Xfinal - Xinitial, dR and dT are < 0 on the last picture, then dL > 0.
it means that this picture seems to show that some losses are increasing from the beginning of the locking process.
several possibilities :
- we saw a strange D-shape effect on the large port of the cavity.
it seems that one of the D-shape mount/mirror is touching the intra-cavity beam producing some ghost effect on this large cavity port.
some cavity axis changing during the beginning of the lock could introduce some additionnal losses.
it can be easily tested by puting the D-shapes far from the beam.
- because of cavity axis changing at the beginning of the lock, the mirror losses are different.
but it is surprising that it is still going in the same direction... more losses at the end.
could be tested by slightly changing the optical axis of the cavity.
- "prior damage" behavior with a bump in the middle of the mirror due to thermal effect which introduces some losses at the end.
=> if it's the case, it's not a good behavior !!! :-(((
can be tested by looking at the wavefront phase in transmission.
- Non linear effect is the coatings.
but the field density seems not so much to produce this kind of effect
- A thermally induced change in the refractive index of the mirrors.
Daniele mentionned a relation between real and imaginary (related to absorption) parts of this refractive index which could explain that a reflectivity change could induce an absorption change.
| Xinyi Lu wrote: |
|
These days, Ronic and I achieved 200kW inside the cavity and 70% coupling efficiency.
- By optimizing the telescope, the coupling reached 70% with iris fully open and maintained 60%-70% coupling at high power.
- The cavity mode went from 2.2mm,2.5mm (38kW) to finally 2.3mm,2.8mm (200kW) without changing a lot.
- Gradually raising the power while optimizing alignment, CEP, and locking, we got the following stable power:
| Amp current (A) |
Injection power (W) |
Circulating power (kW) |
Gain |
| 2 |
10 |
38 |
3800 |
| 2.3 |
14 |
50 |
3571 |
| 3 |
22 |
70 |
3181 |
| 4 |
35 |
115 |
3285 |
| 5 |
48 |
158 |
3292 |
| 8 |
87(Estimated) |
202 |
2322 |
- Next steps:
- Explain the strange drop phenomenon that occurs at high power, where both transmission and reflection drop, as in Fig. 2.
- Maintains a half-hour locking at 200kW. Now the temperature of the amplifier at 8A is over 40 degrees, which may be risky.
|
|
|
|
|
|
|
| Attachment 1: record.png
|  |
| Attachment 2: power_vs_time_550.jpg
|  |
| Attachment 3: 1A.JPG
|  |
|
209
|
Wed Apr 3 08:53:33 2024 |
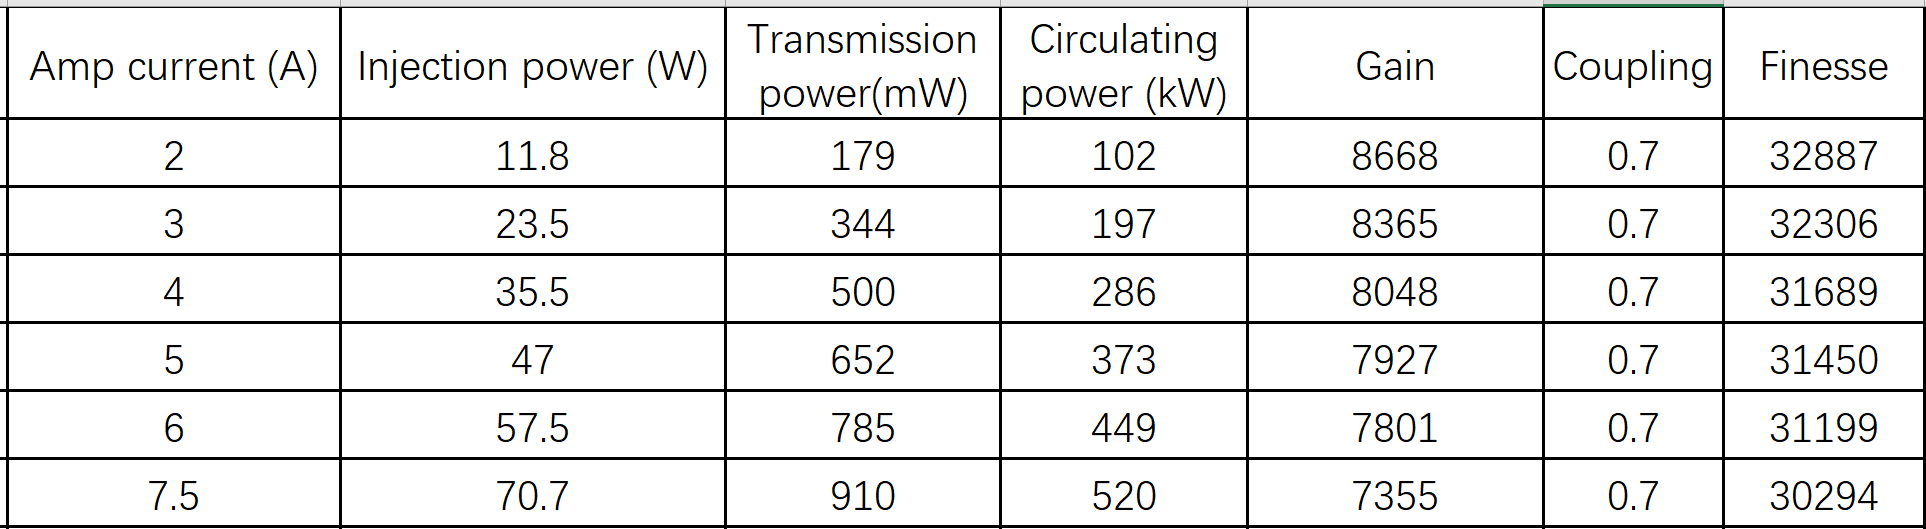
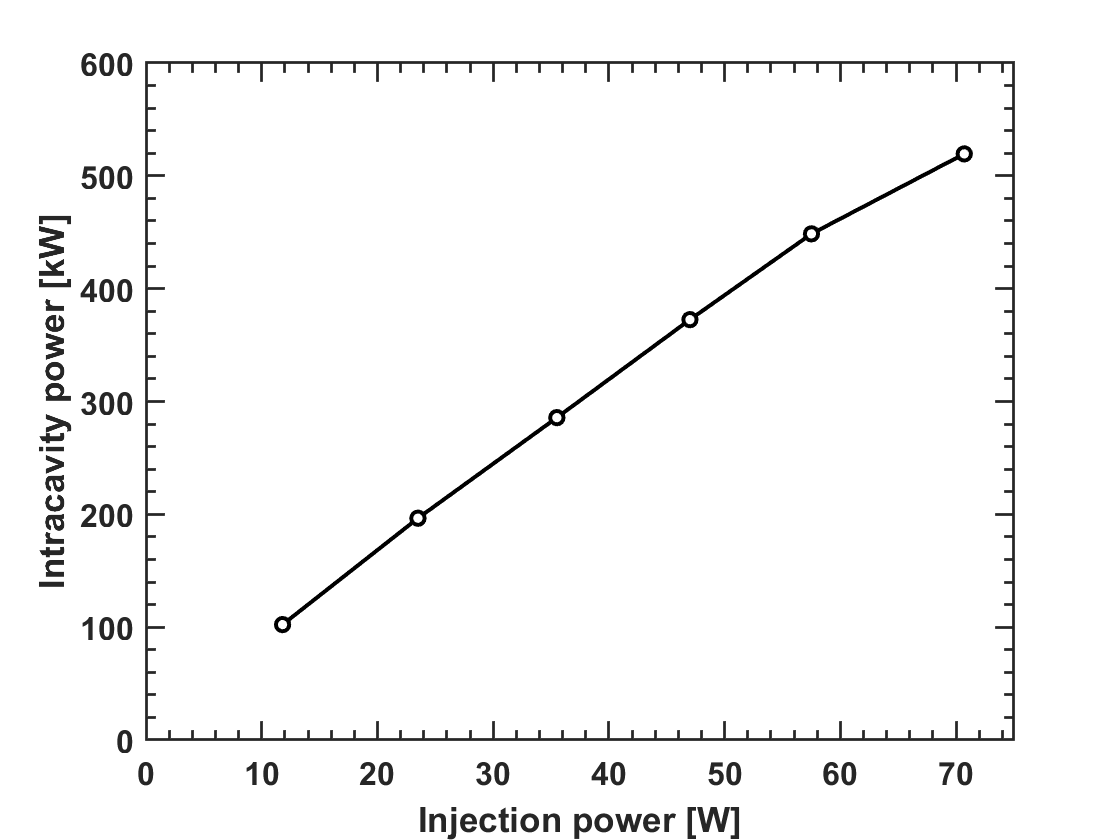
Xinyi Lu | Fixed | info | lasers and optics | Optical room | High power experiments (520kW) | Yesterday, Ronic, Xing, Qili and I achieved a more stable 520kW power at 7.5A (71W injection) by optimizing the alignment and locking parameters. (Figure 1)
- The cavity can be stable locked when airflow is on. At 7.5A, the pump temperature is about 28℃. The chiller temperature didn't change, to the same 23 ℃ setting. We can try 8A later (75W injection) for a short time;
- Figure 2 demonstrates the cavity mode variation, wy/Pc ~ 1.7 mm/MW, half that of the OL paper (3.3 mm/MW). The thermal deformation of our device is much smaller.
- The experimental data are shown in Figure 3. Figure 4 shows the injection power vs circulating power.
- There are some tests that can be done at the moment. I'll update on the elog after discussing the necessity today. ^_^
| Xinyi Lu wrote: |
|
Last week, we achieved a stable intracavity average power of 500kW, limited by amplifier power. The experimental data are shown in Figure 1.
- We measured the transmitted laser with a power meter in the windows behind M2 and M4 respectively, and the results were consistent, so the measurements were credible.
- There is only one transmitted laser spot behind both M2 and M4.
- We measured 10-minute locking data at different powers (Figure 2). 480 kW data was not optimized, and we will add 500 kW locking data later.
- We compared cavity modes at different powers (Figure 3). There are fluctuations because we only saved one data at one power. More data will be collected for averaging later.
- After finishing the high-power experiments, we will measure the finesse and the transmission of the mirrors used. As well as the pulse duration, spectrum, phase noise, and repetition rate of the laser.
| Xinyi Lu wrote: |
|
Today, Ronic, Daniele, Aurélien and I measured the amplifier power and mirror transmission.
| Current (A) |
0 (2rd stage) |
1 |
2 |
3 |
4 |
5 |
6 |
7 |
7.5 |
8 |
| Power (W) |
1 |
1.8 |
11.8 |
23.5 |
35.5 |
47 |
57.5 |
66.9 |
70.7 |
74.9 |
For transmission measurements, we used the same new mirrors as Sbox and ThomX, and installed an iris and a 2-inch mount to block the scattering laser.
The angle of incidence during the measurement was about 0.5°. We changed the angle and the measurements remained the same.
| Mirror Number |
PL-0898 |
PL-10978 |
| Nominal Value |
3 ppm |
115 ppm |
| Measured Value |
1.75 ppm |
113 ppm |
If the mirror being used also has a transmission of 1.75 ppm, the original 270kW is actually 463kW!!! The gain is 6549 and the finesse is 28585 (70% coupling).
We will do more tests to check it.
- Redo the experiment and check the spot behind the window at high power.
- Move the power meter to the plane mirror M2 window. It was previously behind the curved mirror M4 window.
- Compare locking curves, cavity mode sizes, and coupling efficiency at different powers.
- After finishing the high-power experiments, we will measure the finesse using CW laser and the transmission of the mirrors used.
| Xinyi Lu wrote: |
|
Today, Ronic and I achieved 272kW inside the cavity at 7.5A. The coupling maintained 60%-70%.
| Amp current (A) |
Injection power (W) |
Circulating power (kW) |
Gain |
| 2 |
10 |
50 |
5000 |
| 3 |
22 |
105 |
4773 |
| 4 |
34 |
156 |
4588 |
| 5 |
47 |
210 |
4468 |
| 6 |
58(Estimated) |
250 |
4310 |
| 7.5 |
76(Estimated) |
272 |
3579 |
- Compared to yesterday's experiment, we moved the position of the D-shaped mirrors farther in two directions to make the higher-order modes just disappear.
- Possible reasons for higher gain: D-shaped mirrors position, high power and pump vacuum cleaned cavity mirrors so that improve the finesse.
- We didn't see the strange drops like yesterday (Figure 1). However, in the window behind the M3, we can see 3 spots correlating with the intracavity power, even though moving the D-shaped very far does not make them disappear, only weakens them. We don't know where they came from. When this round of experiments is over, we can open the cavity and observe the optical paths.
- Next steps:
- Repeat the experiment to ensure that the gain does not drop.
- Long-term measurement at maximum power when the amplifier temperature is safe.
- Measure the transmittance of the cavity mirrors and the amplifier power.
- Open the cavity and observe the optical paths and the mirror surface.
| Xinyi Lu wrote: |
|
all the injection power in the chart have not been measured recently but during the Loic thesis period.
and these old measurements stopped at 5.5A of pump current.... so, the data at "8A" is a pure estimation.
about the last measurement :
it was made at 6A/8A/8A/8A for the 4 pump diodes of the amplifier (because 1st stage has a Peltier issue and we cannot check its temperature), so the average current is 7.5A instead of 8A.
and the linear scale between pump current and amplifier power is ~ 12W/A, then the estimated amplifier power for the last measurement is 76W instead of 87W
and the estimated gain is more 2658.
for this current, the amplifier works out of its nominal limits (temperature set at 25°C but measured at 30°C !!!) and the fans of the crate are making noise like hell.
so the last gain estimation should be treated very cautiously.
about the transmission and reflection signals behavior, one can write :
R + T + L = 1 => energy conservation for the cavity.
dR + dT + dL = 0 => dL = - (dR + dT)
if dX = Xfinal - Xinitial, dR and dT are < 0 on the last picture, then dL > 0.
it means that this picture seems to show that some losses are increasing from the beginning of the locking process.
several possibilities :
- we saw a strange D-shape effect on the large port of the cavity.
it seems that one of the D-shape mount/mirror is touching the intra-cavity beam producing some ghost effect on this large cavity port.
some cavity axis changing during the beginning of the lock could introduce some additionnal losses.
it can be easily tested by puting the D-shapes far from the beam.
- because of cavity axis changing at the beginning of the lock, the mirror losses are different.
but it is surprising that it is still going in the same direction... more losses at the end.
could be tested by slightly changing the optical axis of the cavity.
- "prior damage" behavior with a bump in the middle of the mirror due to thermal effect which introduces some losses at the end.
=> if it's the case, it's not a good behavior !!! :-(((
can be tested by looking at the wavefront phase in transmission.
- Non linear effect is the coatings.
but the field density seems not so much to produce this kind of effect
- A thermally induced change in the refractive index of the mirrors.
Daniele mentionned a relation between real and imaginary (related to absorption) parts of this refractive index which could explain that a reflectivity change could induce an absorption change.
| Xinyi Lu wrote: |
|
These days, Ronic and I achieved 200kW inside the cavity and 70% coupling efficiency.
- By optimizing the telescope, the coupling reached 70% with iris fully open and maintained 60%-70% coupling at high power.
- The cavity mode went from 2.2mm,2.5mm (38kW) to finally 2.3mm,2.8mm (200kW) without changing a lot.
- Gradually raising the power while optimizing alignment, CEP, and locking, we got the following stable power:
| Amp current (A) |
Injection power (W) |
Circulating power (kW) |
Gain |
| 2 |
10 |
38 |
3800 |
| 2.3 |
14 |
50 |
3571 |
| 3 |
22 |
70 |
3181 |
| 4 |
35 |
115 |
3285 |
| 5 |
48 |
158 |
3292 |
| 8 |
87(Estimated) |
202 |
2322 |
- Next steps:
- Explain the strange drop phenomenon that occurs at high power, where both transmission and reflection drop, as in Fig. 2.
- Maintains a half-hour locking at 200kW. Now the temperature of the amplifier at 8A is over 40 degrees, which may be risky.
|
|
|
|
|
|
| Attachment 1: power_vs_time.png
|  |
| Attachment 2: cavitymode_vs_power_1.png
|  |
| Attachment 3: record.png
|  |
| Attachment 4: injection_power_vs_intra_power.png
|  |
|
208
|
Tue Apr 2 08:39:17 2024 |
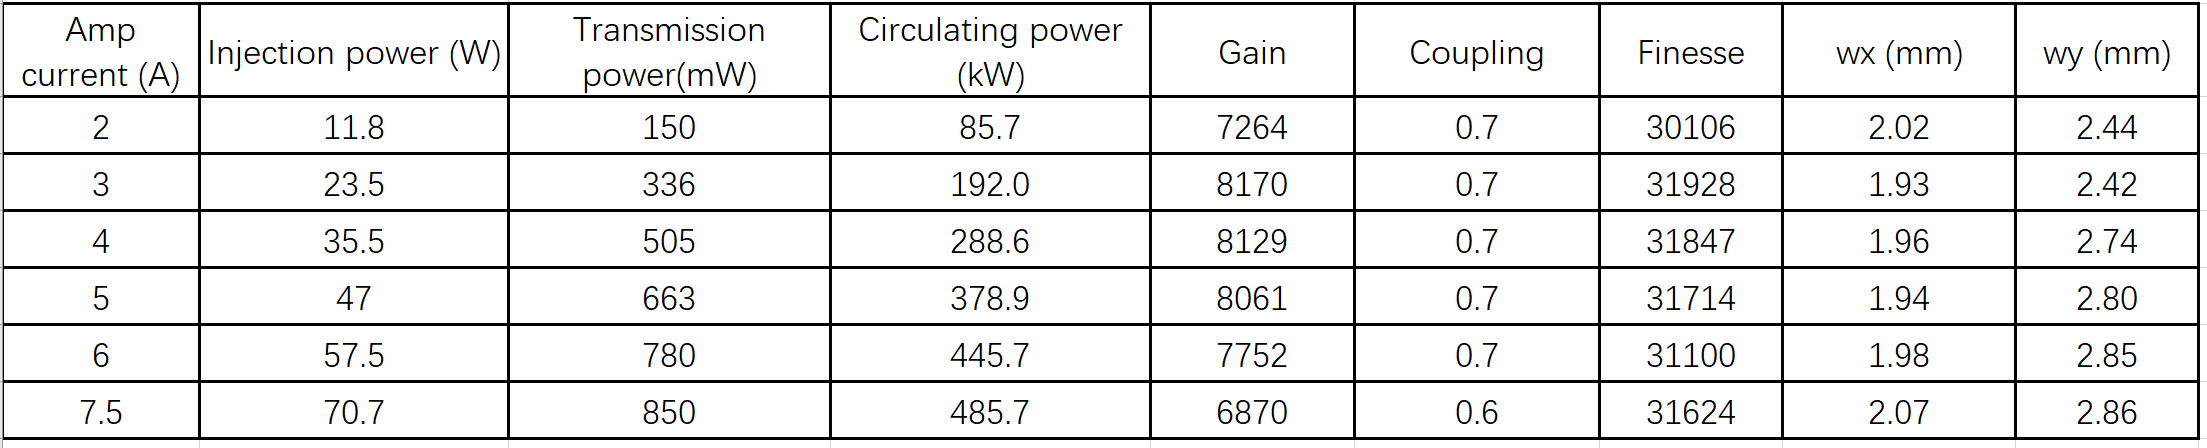
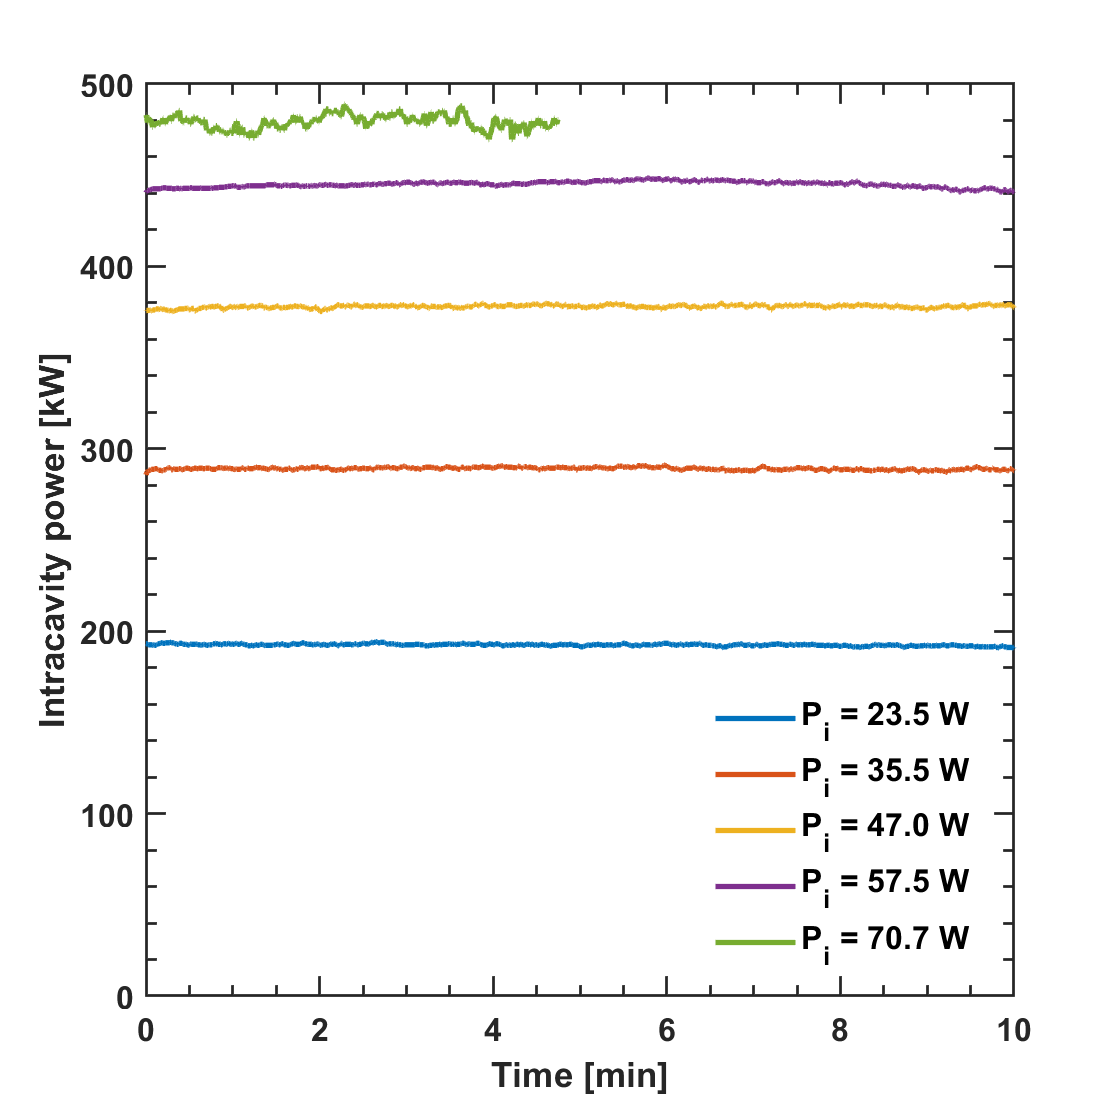
Xinyi Lu | Fixed | info | lasers and optics | Optical room | High power experiments (500kW) | Last week, we achieved a stable intracavity average power of 500kW, limited by amplifier power. The experimental data are shown in Figure 1.
- We measured the transmitted laser with a power meter in the windows behind M2 and M4 respectively, and the results were consistent, so the measurements were credible.
- There is only one transmitted laser spot behind both M2 and M4.
- We measured 10-minute locking data at different powers (Figure 2). 480 kW data was not optimized, and we will add 500 kW locking data later.
- We compared cavity modes at different powers (Figure 3). There are fluctuations because we only saved one data at one power. More data will be collected for averaging later.
- After finishing the high-power experiments, we will measure the finesse and the transmission of the mirrors used. As well as the pulse duration, spectrum, phase noise, and repetition rate of the laser.
| Xinyi Lu wrote: |
|
Today, Ronic, Daniele, Aurélien and I measured the amplifier power and mirror transmission.
| Current (A) |
0 (2rd stage) |
1 |
2 |
3 |
4 |
5 |
6 |
7 |
7.5 |
8 |
| Power (W) |
1 |
1.8 |
11.8 |
23.5 |
35.5 |
47 |
57.5 |
66.9 |
70.7 |
74.9 |
For transmission measurements, we used the same new mirrors as Sbox and ThomX, and installed an iris and a 2-inch mount to block the scattering laser.
The angle of incidence during the measurement was about 0.5°. We changed the angle and the measurements remained the same.
| Mirror Number |
PL-0898 |
PL-10978 |
| Nominal Value |
3 ppm |
115 ppm |
| Measured Value |
1.75 ppm |
113 ppm |
If the mirror being used also has a transmission of 1.75 ppm, the original 270kW is actually 463kW!!! The gain is 6549 and the finesse is 28585 (70% coupling).
We will do more tests to check it.
- Redo the experiment and check the spot behind the window at high power.
- Move the power meter to the plane mirror M2 window. It was previously behind the curved mirror M4 window.
- Compare locking curves, cavity mode sizes, and coupling efficiency at different powers.
- After finishing the high-power experiments, we will measure the finesse using CW laser and the transmission of the mirrors used.
| Xinyi Lu wrote: |
|
Today, Ronic and I achieved 272kW inside the cavity at 7.5A. The coupling maintained 60%-70%.
| Amp current (A) |
Injection power (W) |
Circulating power (kW) |
Gain |
| 2 |
10 |
50 |
5000 |
| 3 |
22 |
105 |
4773 |
| 4 |
34 |
156 |
4588 |
| 5 |
47 |
210 |
4468 |
| 6 |
58(Estimated) |
250 |
4310 |
| 7.5 |
76(Estimated) |
272 |
3579 |
- Compared to yesterday's experiment, we moved the position of the D-shaped mirrors farther in two directions to make the higher-order modes just disappear.
- Possible reasons for higher gain: D-shaped mirrors position, high power and pump vacuum cleaned cavity mirrors so that improve the finesse.
- We didn't see the strange drops like yesterday (Figure 1). However, in the window behind the M3, we can see 3 spots correlating with the intracavity power, even though moving the D-shaped very far does not make them disappear, only weakens them. We don't know where they came from. When this round of experiments is over, we can open the cavity and observe the optical paths.
- Next steps:
- Repeat the experiment to ensure that the gain does not drop.
- Long-term measurement at maximum power when the amplifier temperature is safe.
- Measure the transmittance of the cavity mirrors and the amplifier power.
- Open the cavity and observe the optical paths and the mirror surface.
| Xinyi Lu wrote: |
|
all the injection power in the chart have not been measured recently but during the Loic thesis period.
and these old measurements stopped at 5.5A of pump current.... so, the data at "8A" is a pure estimation.
about the last measurement :
it was made at 6A/8A/8A/8A for the 4 pump diodes of the amplifier (because 1st stage has a Peltier issue and we cannot check its temperature), so the average current is 7.5A instead of 8A.
and the linear scale between pump current and amplifier power is ~ 12W/A, then the estimated amplifier power for the last measurement is 76W instead of 87W
and the estimated gain is more 2658.
for this current, the amplifier works out of its nominal limits (temperature set at 25°C but measured at 30°C !!!) and the fans of the crate are making noise like hell.
so the last gain estimation should be treated very cautiously.
about the transmission and reflection signals behavior, one can write :
R + T + L = 1 => energy conservation for the cavity.
dR + dT + dL = 0 => dL = - (dR + dT)
if dX = Xfinal - Xinitial, dR and dT are < 0 on the last picture, then dL > 0.
it means that this picture seems to show that some losses are increasing from the beginning of the locking process.
several possibilities :
- we saw a strange D-shape effect on the large port of the cavity.
it seems that one of the D-shape mount/mirror is touching the intra-cavity beam producing some ghost effect on this large cavity port.
some cavity axis changing during the beginning of the lock could introduce some additionnal losses.
it can be easily tested by puting the D-shapes far from the beam.
- because of cavity axis changing at the beginning of the lock, the mirror losses are different.
but it is surprising that it is still going in the same direction... more losses at the end.
could be tested by slightly changing the optical axis of the cavity.
- "prior damage" behavior with a bump in the middle of the mirror due to thermal effect which introduces some losses at the end.
=> if it's the case, it's not a good behavior !!! :-(((
can be tested by looking at the wavefront phase in transmission.
- Non linear effect is the coatings.
but the field density seems not so much to produce this kind of effect
- A thermally induced change in the refractive index of the mirrors.
Daniele mentionned a relation between real and imaginary (related to absorption) parts of this refractive index which could explain that a reflectivity change could induce an absorption change.
| Xinyi Lu wrote: |
|
These days, Ronic and I achieved 200kW inside the cavity and 70% coupling efficiency.
- By optimizing the telescope, the coupling reached 70% with iris fully open and maintained 60%-70% coupling at high power.
- The cavity mode went from 2.2mm,2.5mm (38kW) to finally 2.3mm,2.8mm (200kW) without changing a lot.
- Gradually raising the power while optimizing alignment, CEP, and locking, we got the following stable power:
| Amp current (A) |
Injection power (W) |
Circulating power (kW) |
Gain |
| 2 |
10 |
38 |
3800 |
| 2.3 |
14 |
50 |
3571 |
| 3 |
22 |
70 |
3181 |
| 4 |
35 |
115 |
3285 |
| 5 |
48 |
158 |
3292 |
| 8 |
87(Estimated) |
202 |
2322 |
- Next steps:
- Explain the strange drop phenomenon that occurs at high power, where both transmission and reflection drop, as in Fig. 2.
- Maintains a half-hour locking at 200kW. Now the temperature of the amplifier at 8A is over 40 degrees, which may be risky.
|
|
|
|
|
| Attachment 1: record.png
|  |
| Attachment 2: power_vs_time.png
|  |
| Attachment 3: cavitymode_vs_power.png
|  |
|
207
|
Fri Mar 29 16:23:34 2024 |
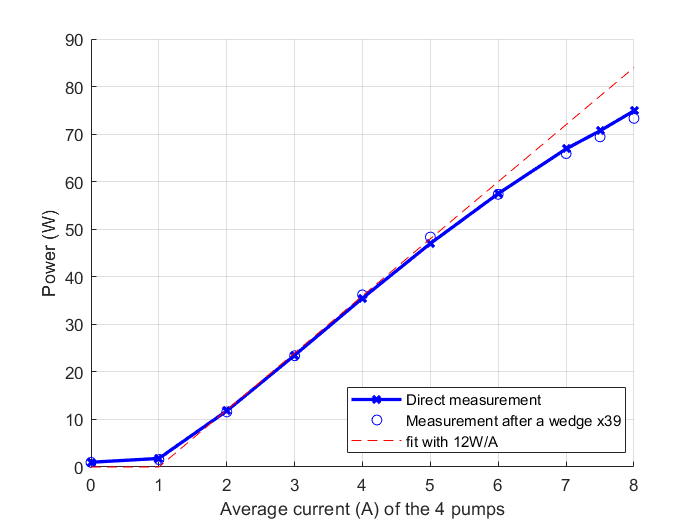
Ronic Chiche | Fixed | info | lasers and optics | detectors and electronics | Optical room | 100W CELIA laser amplifier "Power vs Pump current" curve | We measured again the 100W CELIA laser amplifier with a pump current until 8A.
as the first current pump of the amplifier has a Peltier issue, we don't exceeded 6A on this stage and we compensated with the 3 other stages.
7A average current is obtained with 6A / 7.3A / 7.3A / 7.4A
7.5A average current is obtained with 6A / 8A / 8A / 8A
8A average current is obtained with 6A / 8.6A / 8.7A / 8.7A
we did the power measured either with the "big" powermeter which is able to handle 100W
and with a smaller powermeter after a wedge, in the reflection path, which is multiplied by 39 to match the big powermeter measurement.
a fit a 12W/A from the cut-off current of 2A is a good estimation until 5A. |
| Attachment 1: CELIA_100W_amplifier_Power_vs_Current.png
|  |
|
206
|
Thu Mar 28 19:03:55 2024 |
Xinyi Lu | Fixed | info | lasers and optics | Optical room | Amplifier power and mirror transmission | Today, Ronic, Daniele, Aurélien and I measured the amplifier power and mirror transmission.
| Current (A) |
0 (2rd stage) |
1 |
2 |
3 |
4 |
5 |
6 |
7 |
7.5 |
8 |
| Power (W) |
1 |
1.8 |
11.8 |
23.5 |
35.5 |
47 |
57.5 |
66.9 |
70.7 |
74.9 |
For transmission measurements, we used the same new mirrors as Sbox and ThomX, and installed an iris and a 2-inch mount to block the scattering laser.
The angle of incidence during the measurement was about 0.5°. We changed the angle and the measurements remained the same.
| Mirror Number |
PL-0898 |
PL-10978 |
| Nominal Value |
3 ppm |
115 ppm |
| Measured Value |
1.75 ppm |
113 ppm |
If the mirror being used also has a transmission of 1.75 ppm, the original 270kW is actually 463kW!!! The gain is 6549 and the finesse is 28585 (70% coupling).
We will do more tests to check it.
- Redo the experiment and check the spot behind the window at high power.
- Move the power meter to the plane mirror M2 window. It was previously behind the curved mirror M4 window.
- Compare locking curves, cavity mode sizes, and coupling efficiency at different powers.
- After finishing the high-power experiments, we will measure the finesse using CW laser and the transmission of the mirrors used.
| Xinyi Lu wrote: |
|
Today, Ronic and I achieved 272kW inside the cavity at 7.5A. The coupling maintained 60%-70%.
| Amp current (A) |
Injection power (W) |
Circulating power (kW) |
Gain |
| 2 |
10 |
50 |
5000 |
| 3 |
22 |
105 |
4773 |
| 4 |
34 |
156 |
4588 |
| 5 |
47 |
210 |
4468 |
| 6 |
58(Estimated) |
250 |
4310 |
| 7.5 |
76(Estimated) |
272 |
3579 |
- Compared to yesterday's experiment, we moved the position of the D-shaped mirrors farther in two directions to make the higher-order modes just disappear.
- Possible reasons for higher gain: D-shaped mirrors position, high power and pump vacuum cleaned cavity mirrors so that improve the finesse.
- We didn't see the strange drops like yesterday (Figure 1). However, in the window behind the M3, we can see 3 spots correlating with the intracavity power, even though moving the D-shaped very far does not make them disappear, only weakens them. We don't know where they came from. When this round of experiments is over, we can open the cavity and observe the optical paths.
- Next steps:
- Repeat the experiment to ensure that the gain does not drop.
- Long-term measurement at maximum power when the amplifier temperature is safe.
- Measure the transmittance of the cavity mirrors and the amplifier power.
- Open the cavity and observe the optical paths and the mirror surface.
| Xinyi Lu wrote: |
|
all the injection power in the chart have not been measured recently but during the Loic thesis period.
and these old measurements stopped at 5.5A of pump current.... so, the data at "8A" is a pure estimation.
about the last measurement :
it was made at 6A/8A/8A/8A for the 4 pump diodes of the amplifier (because 1st stage has a Peltier issue and we cannot check its temperature), so the average current is 7.5A instead of 8A.
and the linear scale between pump current and amplifier power is ~ 12W/A, then the estimated amplifier power for the last measurement is 76W instead of 87W
and the estimated gain is more 2658.
for this current, the amplifier works out of its nominal limits (temperature set at 25°C but measured at 30°C !!!) and the fans of the crate are making noise like hell.
so the last gain estimation should be treated very cautiously.
about the transmission and reflection signals behavior, one can write :
R + T + L = 1 => energy conservation for the cavity.
dR + dT + dL = 0 => dL = - (dR + dT)
if dX = Xfinal - Xinitial, dR and dT are < 0 on the last picture, then dL > 0.
it means that this picture seems to show that some losses are increasing from the beginning of the locking process.
several possibilities :
- we saw a strange D-shape effect on the large port of the cavity.
it seems that one of the D-shape mount/mirror is touching the intra-cavity beam producing some ghost effect on this large cavity port.
some cavity axis changing during the beginning of the lock could introduce some additionnal losses.
it can be easily tested by puting the D-shapes far from the beam.
- because of cavity axis changing at the beginning of the lock, the mirror losses are different.
but it is surprising that it is still going in the same direction... more losses at the end.
could be tested by slightly changing the optical axis of the cavity.
- "prior damage" behavior with a bump in the middle of the mirror due to thermal effect which introduces some losses at the end.
=> if it's the case, it's not a good behavior !!! :-(((
can be tested by looking at the wavefront phase in transmission.
- Non linear effect is the coatings.
but the field density seems not so much to produce this kind of effect
- A thermally induced change in the refractive index of the mirrors.
Daniele mentionned a relation between real and imaginary (related to absorption) parts of this refractive index which could explain that a reflectivity change could induce an absorption change.
| Xinyi Lu wrote: |
|
These days, Ronic and I achieved 200kW inside the cavity and 70% coupling efficiency.
- By optimizing the telescope, the coupling reached 70% with iris fully open and maintained 60%-70% coupling at high power.
- The cavity mode went from 2.2mm,2.5mm (38kW) to finally 2.3mm,2.8mm (200kW) without changing a lot.
- Gradually raising the power while optimizing alignment, CEP, and locking, we got the following stable power:
| Amp current (A) |
Injection power (W) |
Circulating power (kW) |
Gain |
| 2 |
10 |
38 |
3800 |
| 2.3 |
14 |
50 |
3571 |
| 3 |
22 |
70 |
3181 |
| 4 |
35 |
115 |
3285 |
| 5 |
48 |
158 |
3292 |
| 8 |
87(Estimated) |
202 |
2322 |
- Next steps:
- Explain the strange drop phenomenon that occurs at high power, where both transmission and reflection drop, as in Fig. 2.
- Maintains a half-hour locking at 200kW. Now the temperature of the amplifier at 8A is over 40 degrees, which may be risky.
|
|
|
|
| Attachment 1: 3rd_amp_power.png
|  |
| Attachment 2: Transmission_measurement.png
|  |
|
205
|
Wed Mar 27 22:37:02 2024 |
Xinyi Lu | Fixed | info | lasers and optics | Optical room | High power experiments (272kW) | Today, Ronic and I achieved 272kW inside the cavity at 7.5A. The coupling maintained 60%-70%.
| Amp current (A) |
Injection power (W) |
Circulating power (kW) |
Gain |
| 2 |
10 |
50 |
5000 |
| 3 |
22 |
105 |
4773 |
| 4 |
34 |
156 |
4588 |
| 5 |
47 |
210 |
4468 |
| 6 |
58(Estimated) |
250 |
4310 |
| 7.5 |
76(Estimated) |
272 |
3579 |
- Compared to yesterday's experiment, we moved the position of the D-shaped mirrors farther in two directions to make the higher-order modes just disappear.
- Possible reasons for higher gain: D-shaped mirrors position, high power and pump vacuum cleaned cavity mirrors so that improve the finesse.
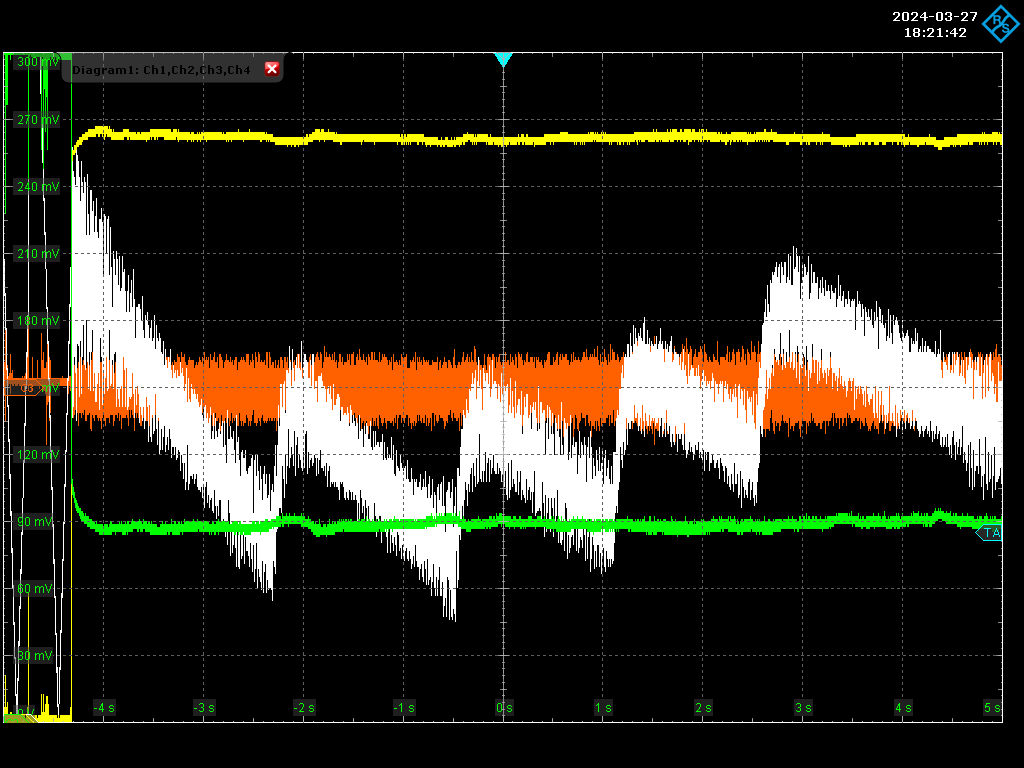
- We didn't see the strange drops like yesterday (Figure 1). However, in the window behind the M3, we can see 3 spots correlating with the intracavity power, even though moving the D-shaped very far does not make them disappear, only weakens them. We don't know where they came from. When this round of experiments is over, we can open the cavity and observe the optical paths.
- Next steps:
- Repeat the experiment to ensure that the gain does not drop.
- Long-term measurement at maximum power when the amplifier temperature is safe.
- Measure the transmittance of the cavity mirrors and the amplifier power.
- Open the cavity and observe the optical paths and the mirror surface.
| Xinyi Lu wrote: |
|
all the injection power in the chart have not been measured recently but during the Loic thesis period.
and these old measurements stopped at 5.5A of pump current.... so, the data at "8A" is a pure estimation.
about the last measurement :
it was made at 6A/8A/8A/8A for the 4 pump diodes of the amplifier (because 1st stage has a Peltier issue and we cannot check its temperature), so the average current is 7.5A instead of 8A.
and the linear scale between pump current and amplifier power is ~ 12W/A, then the estimated amplifier power for the last measurement is 76W instead of 87W
and the estimated gain is more 2658.
for this current, the amplifier works out of its nominal limits (temperature set at 25°C but measured at 30°C !!!) and the fans of the crate are making noise like hell.
so the last gain estimation should be treated very cautiously.
about the transmission and reflection signals behavior, one can write :
R + T + L = 1 => energy conservation for the cavity.
dR + dT + dL = 0 => dL = - (dR + dT)
if dX = Xfinal - Xinitial, dR and dT are < 0 on the last picture, then dL > 0.
it means that this picture seems to show that some losses are increasing from the beginning of the locking process.
several possibilities :
- we saw a strange D-shape effect on the large port of the cavity.
it seems that one of the D-shape mount/mirror is touching the intra-cavity beam producing some ghost effect on this large cavity port.
some cavity axis changing during the beginning of the lock could introduce some additionnal losses.
it can be easily tested by puting the D-shapes far from the beam.
- because of cavity axis changing at the beginning of the lock, the mirror losses are different.
but it is surprising that it is still going in the same direction... more losses at the end.
could be tested by slightly changing the optical axis of the cavity.
- "prior damage" behavior with a bump in the middle of the mirror due to thermal effect which introduces some losses at the end.
=> if it's the case, it's not a good behavior !!! :-(((
can be tested by looking at the wavefront phase in transmission.
- Non linear effect is the coatings.
but the field density seems not so much to produce this kind of effect
- A thermally induced change in the refractive index of the mirrors.
Daniele mentionned a relation between real and imaginary (related to absorption) parts of this refractive index which could explain that a reflectivity change could induce an absorption change.
| Xinyi Lu wrote: |
|
These days, Ronic and I achieved 200kW inside the cavity and 70% coupling efficiency.
- By optimizing the telescope, the coupling reached 70% with iris fully open and maintained 60%-70% coupling at high power.
- The cavity mode went from 2.2mm,2.5mm (38kW) to finally 2.3mm,2.8mm (200kW) without changing a lot.
- Gradually raising the power while optimizing alignment, CEP, and locking, we got the following stable power:
| Amp current (A) |
Injection power (W) |
Circulating power (kW) |
Gain |
| 2 |
10 |
38 |
3800 |
| 2.3 |
14 |
50 |
3571 |
| 3 |
22 |
70 |
3181 |
| 4 |
35 |
115 |
3285 |
| 5 |
48 |
158 |
3292 |
| 8 |
87(Estimated) |
202 |
2322 |
- Next steps:
- Explain the strange drop phenomenon that occurs at high power, where both transmission and reflection drop, as in Fig. 2.
- Maintains a half-hour locking at 200kW. Now the temperature of the amplifier at 8A is over 40 degrees, which may be risky.
|
|
|
| Attachment 1: Screenshot_2024-03-27_7_270kW_7.5A.png
|  |
| Attachment 2: 210_kW_power_at_5A_injection.png
|  |
| Attachment 3: 272.3kW_at_7.5A.jpg
|  |
|
204
|
Wed Mar 27 09:47:37 2024 |
Xinyi Lu | Fixed | info | lasers and optics | Optical room | High power experiments (200kW) | all the injection power in the chart have not been measured recently but during the Loic thesis period.
and these old measurements stopped at 5.5A of pump current.... so, the data at "8A" is a pure estimation.
about the last measurement :
it was made at 6A/8A/8A/8A for the 4 pump diodes of the amplifier (because 1st stage has a Peltier issue and we cannot check its temperature), so the average current is 7.5A instead of 8A.
and the linear scale between pump current and amplifier power is ~ 12W/A, then the estimated amplifier power for the last measurement is 76W instead of 87W
and the estimated gain is more 2658.
for this current, the amplifier works out of its nominal limits (temperature set at 25°C but measured at 30°C !!!) and the fans of the crate are making noise like hell.
so the last gain estimation should be treated very cautiously.
about the transmission and reflection signals behavior, one can write :
R + T + L = 1 => energy conservation for the cavity.
dR + dT + dL = 0 => dL = - (dR + dT)
if dX = Xfinal - Xinitial, dR and dT are < 0 on the last picture, then dL > 0.
it means that this picture seems to show that some losses are increasing from the beginning of the locking process.
several possibilities :
- we saw a strange D-shape effect on the large port of the cavity.
it seems that one of the D-shape mount/mirror is touching the intra-cavity beam producing some ghost effect on this large cavity port.
some cavity axis changing during the beginning of the lock could introduce some additionnal losses.
it can be easily tested by puting the D-shapes far from the beam.
- because of cavity axis changing at the beginning of the lock, the mirror losses are different.
but it is surprising that it is still going in the same direction... more losses at the end.
could be tested by slightly changing the optical axis of the cavity.
- "prior damage" behavior with a bump in the middle of the mirror due to thermal effect which introduces some losses at the end.
=> if it's the case, it's not a good behavior !!! :-(((
can be tested by looking at the wavefront phase in transmission.
- Non linear effect is the coatings.
but the field density seems not so much to produce this kind of effect
- A thermally induced change in the refractive index of the mirrors.
Daniele mentionned a relation between real and imaginary (related to absorption) parts of this refractive index which could explain that a reflectivity change could induce an absorption change.
| Xinyi Lu wrote: |
|
These days, Ronic and I achieved 200kW inside the cavity and 70% coupling efficiency.
- By optimizing the telescope, the coupling reached 70% with iris fully open and maintained 60%-70% coupling at high power.
- The cavity mode went from 2.2mm,2.5mm (38kW) to finally 2.3mm,2.8mm (200kW) without changing a lot.
- Gradually raising the power while optimizing alignment, CEP, and locking, we got the following stable power:
| Amp current (A) |
Injection power (W) |
Circulating power (kW) |
Gain |
| 2 |
10 |
38 |
3800 |
| 2.3 |
14 |
50 |
3571 |
| 3 |
22 |
70 |
3181 |
| 4 |
35 |
115 |
3285 |
| 5 |
48 |
158 |
3292 |
| 8 |
87(Estimated) |
202 |
2322 |
- Next steps:
- Explain the strange drop phenomenon that occurs at high power, where both transmission and reflection drop, as in Fig. 2.
- Maintains a half-hour locking at 200kW. Now the temperature of the amplifier at 8A is over 40 degrees, which may be risky.
|
|
|
203
|
Tue Mar 26 19:36:48 2024 |
Xinyi Lu | Fixed | info | lasers and optics | Optical room | High power experiments (200kW) | These days, Ronic and I achieved 200kW inside the cavity and 70% coupling efficiency.
- By optimizing the telescope, the coupling reached 70% with iris fully open and maintained 60%-70% coupling at high power.
- The cavity mode went from 2.2mm,2.5mm (38kW) to finally 2.3mm,2.8mm (200kW) without changing a lot.
- Gradually raising the power while optimizing alignment, CEP, and locking, we got the following stable power:
| Amp current (A) |
Injection power (W) |
Circulating power (kW) |
Gain |
| 2 |
10 |
38 |
3800 |
| 2.3 |
14 |
50 |
3571 |
| 3 |
22 |
70 |
3181 |
| 4 |
35 |
115 |
3285 |
| 5 |
48 |
158 |
3292 |
| 8 |
87(Estimated) |
202 |
2322 |
- Next steps:
- Explain the strange drop phenomenon that occurs at high power, where both transmission and reflection drop, as in Fig. 2.
- Maintains a half-hour locking at 200kW. Now the temperature of the amplifier at 8A is over 40 degrees, which may be risky.
|
| Attachment 1: 202kW_power_at_8A_injection.png
|  |
| Attachment 2: Strange_drops.jpg
|  |
|
202
|
Thu Mar 21 17:32:59 2024 |
Xinyi Lu | Fixed | info | lasers and optics | Optical room | Polarization issue & 50kW with 22W injection | Today, Ronic and I lock the cavity on the other polarization and achieved 50kW with 22W injection.
- After we optimize and lock the cavity in vertical polarization, we rotate the waveplate at the transmission to minimize the signal, then rotate the waveplate at the injection laser to maximize the signal. We lock the cavity in this horizontal polarization and optimize CEP and alignment. The results are: when injected at 10W, the circulating power in vertical polarization is 21.4kW and in horizontal polarization is 23.3kW. The coupling are both ~30%.
- The cavity reflection signal obtained in horizontal polarization is weaker than that in vertical polarization (1/10), so we usually lock on vertical polarization first.
- We then increase the power to see the change in coupling. From current 2A to 3A, coupling change from 30% to 40%. Finally, we obtained a circulating power of 50kW with 22W injection (3A current). In the initial stage of locking, high-order modes appear, but in stable locking, there is only fundamental mode and no mode degeneration. Although there are many fluctuations in transmission and reflection.
- Tomorrow, we will optimize the coupling and add removable stages under the telescope.
| Xinyi Lu wrote: |
|
just to add some details :
about the S and P polarization frequency shift:
the PZT scan is 10Vpp at 3.1Hz => the slope is 62 V/s because of the triangle shape of the PZT scan.
so 100µs of separation of the 2 polarization is equivalent to 6.2mV on the PZT.
as the PZT sensitivity is 3.7Hz/V on Frep, the separation of the 2 polarization is equivalent to 23mHz on Frep.
△Frep/Frep = △v/v => △v = 41.8 kHz
about the possibility to separate S and P polarization states on secondary resonances:
the total spectral width is ~2nm which is equivalent to 565GHz and contain about 3500 laser harmonics at 160MHz.
the central spectral harmonic is roughly the number n0=1.82M, so with the first secondary resonance condition, the Frep/FSR detuning corresponds to n0*Frep = (n0+1) FSR
so (Frep - FSR) = FSR/n0 ~ 88Hz.
then if the central frequency, related to n0, is on an S-polarization resonance, the harmonics at (n0+475) will be on the P-polarization resonance and so on...
the conclusion is the power detected by a photodiode on secondary resonances are a mix of S and P polarizations (if the laser input beam is also a combination of S and P polarizations)
and we cannot make an observation of different peaks with different polarizations in transmission of the FP-cavity.
for that, it is mandatory to be on the main resonance with Frep = FSR (CEP~0) as condition of resonance.
| Xinyi Lu wrote: |
|
These days, Ronic, Aurélien, Fatematuj and I have been doing some tests on polarization issue, trying to see if it is possible to obtain higher gain under other polarization conditions.
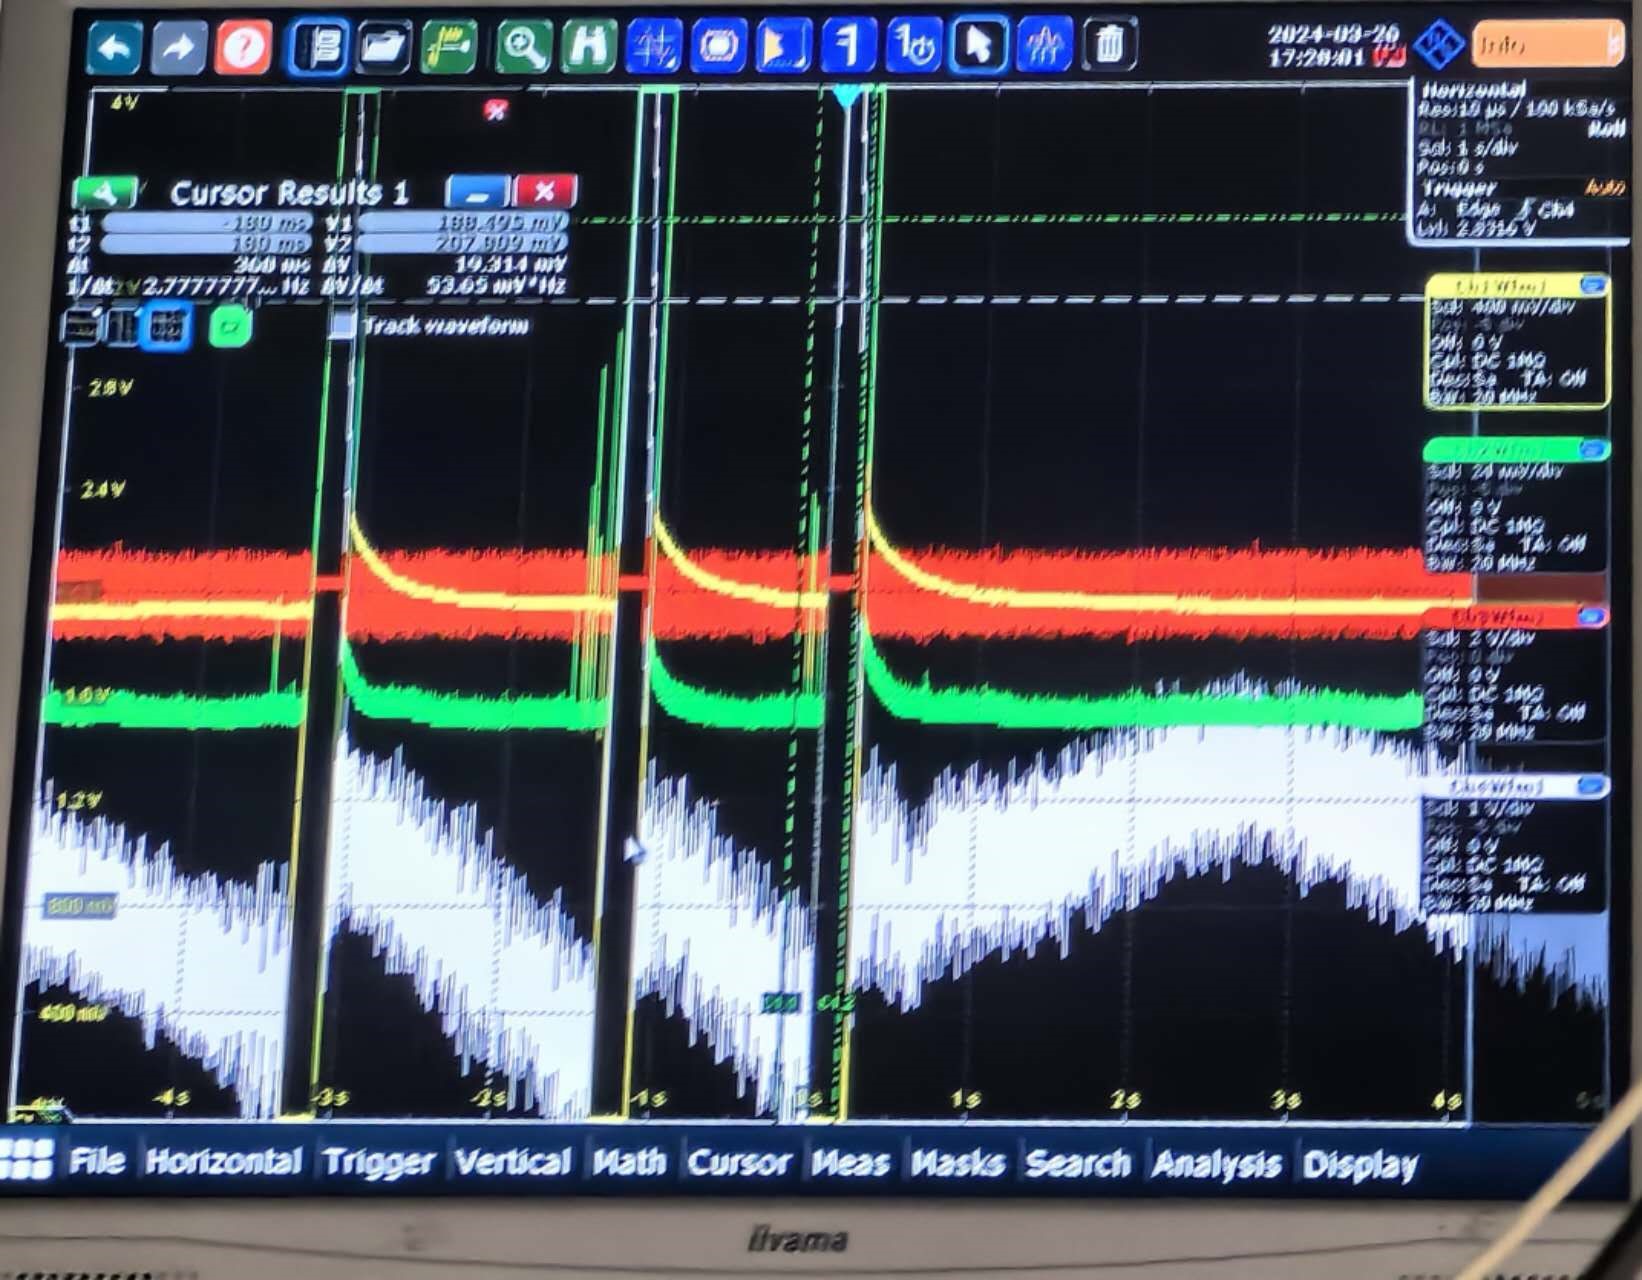
- We installed an additional half-wave plate + PBS + PD at the transmission. By rotating the waveplate of the injection laser, we can compare the resonance signals of single and full polarization. Figures 1 and 2 demonstrate this comparison. The yellow curve is full polarization and the green one is single polarization. The intensity ratio of the different polarizations is unstable in the open-loop state.
- Based on PZT scan frequency = 3.1 Hz, amplitude = 10 V, sensitivity = 3.7 Hz/V, time difference between two polarization peaks = 100 us, we can calculate △Frep = 10mHz and △v = 42kHz, which means the frequency variation between two polarizations. We see two polarizations only at the main resonance.
- By the way, we found two spots behind the M3 window (see Figure 3) and the power of both is related to the intra-cavity power. We moved the position of D-shaped mirror and the second spot became weaker and larger like mirror's edge. Maybe the D-shaped mirror is causing a part of laser to be reflected through the window, but it's unclear exactly how the optical path works.
Next steps:
- We will lock the cavity in different polarization and see if there is higher gain.
- We will move D-shaped to the maximum and see if the second spot disappears.
- We will check the coupling value and try to optimize the telescope using adjustable stages.
| Xinyi Lu wrote: |
|
Today, Ronic and I optimized the locking at the amplifier current of 2 A and obtained ~ 21 kW inside the cavity.
- When all the iris open, the injected power is 10 W and the coupling is ~ 40%, corresponding to an effective gain of 2,100 and a full gain of 5,250. But the coupling may not be the true value because there is a large spot around the output beam.
- We have optimized the CEP, alignment, D-shaped mirrors and locking state. We optimized alignment after leaving the iris open and the inside power went from 14kW to 21kW.
- The transmission and reflection signals both have some same fluctuations, and they seem to come from the cavity. It's possible that the over-angled mirror mount could be the cause, but not sure. We will check in different power and see the stability of the signal.
- In addition, we found that the design values of the mirror incidence angles for the SBOX (3.359°, 5.900°) are different from the mirror ratings (1.146°). This may result in parameters such as reflection and transmission being different from the datasheet. It will also change the estimated maximum finesse, gain, and power inside the cavity. It might be better if the mirror parameters could be recalculated based on the actual angle of incidence.
| Xinyi Lu wrote: |
|
- Today, Ronic and I locked at the amplifier current of 2 A and obtained ~60% coupling after optimizing the CEP (see Figure 1).
- The injected power is 10 W at 2 A. We measured only 14 kW inside the cavity, which corresponds to an effective gain of 1,400 and a full gain of 2,300. The cavity finesse is 23,000 and the normal gain should be around 6,200.
- We found fluctuations in transmission, possibly because of mode degradation. Tomorrow we will use D-shape mirrors to suppress high-order modes and optimize alignment and locking.
| Xinyi Lu wrote: |
|
Today, Ronic and I installed the new telescope and locked the cavity.
- We locked at the amplifier current of 1 A and obtained 32% of coupling. (see Figure 1)
- The telescope was designed for a current of 2 A (output power ~10 W). To inject this power, we need to add some filters to devices.
- For CEP tuning, when we changed the AOM frequency while cavity locking, sometimes it caused unlock and power drops. It will be dangerous in high-power cases. So it's better to optimize the AOM frequency in low power and just tune the laser current in high power. Now the current variation range of the menhir laser is 750mA to 950mA.
| Xinyi Lu wrote: |
|
- These days, Ronic, Fatematuj and I measured the beam parameters of the output of the third-stage amplifier.
- We used 2 wedges and reflection filters to reduce the intensity on the CCD.
- We measured multiple points at pump current of 2 A (output power ~10 W). The waist diameter of the output is w_x = 792.26 um, w_y=873.90 um.
- The next step is to design the telescope and improve the coupling efficiency.
|
|
|
|
|
|
|
| Attachment 1: 50kW_with_22W_injection.png
|  |
| Attachment 2: 50_kW_power_at_3A_injection.png
|  |
|
201
|
Thu Mar 21 09:26:50 2024 |
Xinyi Lu | Fixed | info | lasers and optics | Optical room | Polarization issue | just to add some details :
about the S and P polarization frequency shift:
the PZT scan is 10Vpp at 3.1Hz => the slope is 62 V/s because of the triangle shape of the PZT scan.
so 100µs of separation of the 2 polarization is equivalent to 6.2mV on the PZT.
as the PZT sensitivity is 3.7Hz/V on Frep, the separation of the 2 polarization is equivalent to 23mHz on Frep.
△Frep/Frep = △v/v => △v = 41.8 kHz
about the possibility to separate S and P polarization states on secondary resonances:
the total spectral width is ~2nm which is equivalent to 565GHz and contain about 3500 laser harmonics at 160MHz.
the central spectral harmonic is roughly the number n0=1.82M, so with the first secondary resonance condition, the Frep/FSR detuning corresponds to n0*Frep = (n0+1) FSR
so (Frep - FSR) = FSR/n0 ~ 88Hz.
then if the central frequency, related to n0, is on an S-polarization resonance, the harmonics at (n0+475) will be on the P-polarization resonance and so on...
the conclusion is the power detected by a photodiode on secondary resonances are a mix of S and P polarizations (if the laser input beam is also a combination of S and P polarizations)
and we cannot make an observation of different peaks with different polarizations in transmission of the FP-cavity.
for that, it is mandatory to be on the main resonance with Frep = FSR (CEP~0) as condition of resonance.
| Xinyi Lu wrote: |
|
These days, Ronic, Aurélien, Fatematuj and I have been doing some tests on polarization issue, trying to see if it is possible to obtain higher gain under other polarization conditions.
- We installed an additional half-wave plate + PBS + PD at the transmission. By rotating the waveplate of the injection laser, we can compare the resonance signals of single and full polarization. Figures 1 and 2 demonstrate this comparison. The yellow curve is full polarization and the green one is single polarization. The intensity ratio of the different polarizations is unstable in the open-loop state.
- Based on PZT scan frequency = 3.1 Hz, amplitude = 10 V, sensitivity = 3.7 Hz/V, time difference between two polarization peaks = 100 us, we can calculate △Frep = 10mHz and △v = 42kHz, which means the frequency variation between two polarizations. We see two polarizations only at the main resonance.
- By the way, we found two spots behind the M3 window (see Figure 3) and the power of both is related to the intra-cavity power. We moved the position of D-shaped mirror and the second spot became weaker and larger like mirror's edge. Maybe the D-shaped mirror is causing a part of laser to be reflected through the window, but it's unclear exactly how the optical path works.
Next steps:
- We will lock the cavity in different polarization and see if there is higher gain.
- We will move D-shaped to the maximum and see if the second spot disappears.
- We will check the coupling value and try to optimize the telescope using adjustable stages.
| Xinyi Lu wrote: |
|
Today, Ronic and I optimized the locking at the amplifier current of 2 A and obtained ~ 21 kW inside the cavity.
- When all the iris open, the injected power is 10 W and the coupling is ~ 40%, corresponding to an effective gain of 2,100 and a full gain of 5,250. But the coupling may not be the true value because there is a large spot around the output beam.
- We have optimized the CEP, alignment, D-shaped mirrors and locking state. We optimized alignment after leaving the iris open and the inside power went from 14kW to 21kW.
- The transmission and reflection signals both have some same fluctuations, and they seem to come from the cavity. It's possible that the over-angled mirror mount could be the cause, but not sure. We will check in different power and see the stability of the signal.
- In addition, we found that the design values of the mirror incidence angles for the SBOX (3.359°, 5.900°) are different from the mirror ratings (1.146°). This may result in parameters such as reflection and transmission being different from the datasheet. It will also change the estimated maximum finesse, gain, and power inside the cavity. It might be better if the mirror parameters could be recalculated based on the actual angle of incidence.
| Xinyi Lu wrote: |
|
- Today, Ronic and I locked at the amplifier current of 2 A and obtained ~60% coupling after optimizing the CEP (see Figure 1).
- The injected power is 10 W at 2 A. We measured only 14 kW inside the cavity, which corresponds to an effective gain of 1,400 and a full gain of 2,300. The cavity finesse is 23,000 and the normal gain should be around 6,200.
- We found fluctuations in transmission, possibly because of mode degradation. Tomorrow we will use D-shape mirrors to suppress high-order modes and optimize alignment and locking.
| Xinyi Lu wrote: |
|
Today, Ronic and I installed the new telescope and locked the cavity.
- We locked at the amplifier current of 1 A and obtained 32% of coupling. (see Figure 1)
- The telescope was designed for a current of 2 A (output power ~10 W). To inject this power, we need to add some filters to devices.
- For CEP tuning, when we changed the AOM frequency while cavity locking, sometimes it caused unlock and power drops. It will be dangerous in high-power cases. So it's better to optimize the AOM frequency in low power and just tune the laser current in high power. Now the current variation range of the menhir laser is 750mA to 950mA.
| Xinyi Lu wrote: |
|
- These days, Ronic, Fatematuj and I measured the beam parameters of the output of the third-stage amplifier.
- We used 2 wedges and reflection filters to reduce the intensity on the CCD.
- We measured multiple points at pump current of 2 A (output power ~10 W). The waist diameter of the output is w_x = 792.26 um, w_y=873.90 um.
- The next step is to design the telescope and improve the coupling efficiency.
|
|
|
|
|
|
|
200
|
Wed Mar 20 18:22:53 2024 |
Xinyi Lu | Fixed | info | lasers and optics | Optical room | Polarization issue | These days, Ronic, Aurélien, Fatematuj and I have been doing some tests on polarization issue, trying to see if it is possible to obtain higher gain under other polarization conditions.
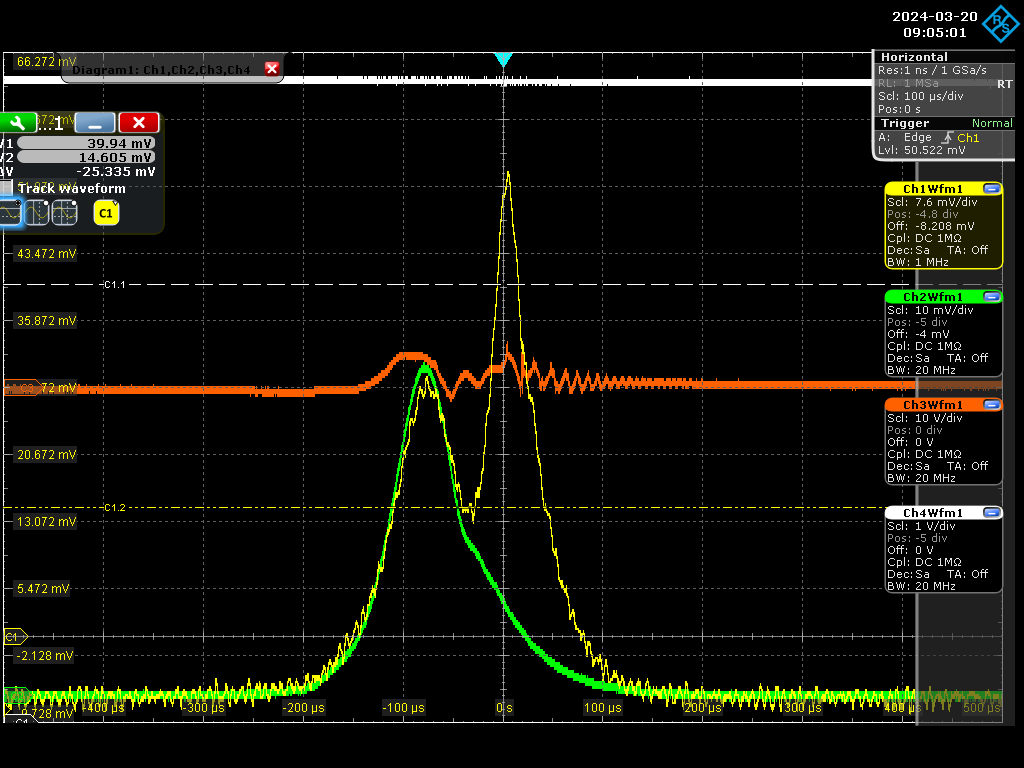
- We installed an additional half-wave plate + PBS + PD at the transmission. By rotating the waveplate of the injection laser, we can compare the resonance signals of single and full polarization. Figures 1 and 2 demonstrate this comparison. The yellow curve is full polarization and the green one is single polarization. The intensity ratio of the different polarizations is unstable in the open-loop state.
- Based on PZT scan frequency = 3.1 Hz, amplitude = 10 V, sensitivity = 3.7 Hz/V, time difference between two polarization peaks = 100 us, we can calculate △Frep = 10mHz and △v = 42kHz, which means the frequency variation between two polarizations. We see two polarizations only at the main resonance.
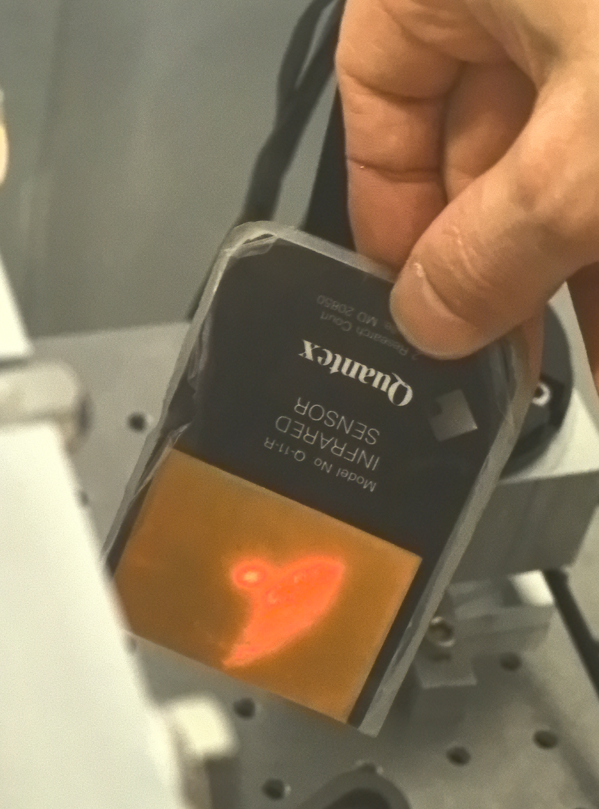
- By the way, we found two spots behind the M3 window (see Figure 3) and the power of both is related to the intra-cavity power. We moved the position of D-shaped mirror and the second spot became weaker and larger like mirror's edge. Maybe the D-shaped mirror is causing a part of laser to be reflected through the window, but it's unclear exactly how the optical path works.
Next steps:
- We will lock the cavity in different polarization and see if there is higher gain.
- We will move D-shaped to the maximum and see if the second spot disappears.
- We will check the coupling value and try to optimize the telescope using adjustable stages.
| Xinyi Lu wrote: |
|
Today, Ronic and I optimized the locking at the amplifier current of 2 A and obtained ~ 21 kW inside the cavity.
- When all the iris open, the injected power is 10 W and the coupling is ~ 40%, corresponding to an effective gain of 2,100 and a full gain of 5,250. But the coupling may not be the true value because there is a large spot around the output beam.
- We have optimized the CEP, alignment, D-shaped mirrors and locking state. We optimized alignment after leaving the iris open and the inside power went from 14kW to 21kW.
- The transmission and reflection signals both have some same fluctuations, and they seem to come from the cavity. It's possible that the over-angled mirror mount could be the cause, but not sure. We will check in different power and see the stability of the signal.
- In addition, we found that the design values of the mirror incidence angles for the SBOX (3.359°, 5.900°) are different from the mirror ratings (1.146°). This may result in parameters such as reflection and transmission being different from the datasheet. It will also change the estimated maximum finesse, gain, and power inside the cavity. It might be better if the mirror parameters could be recalculated based on the actual angle of incidence.
| Xinyi Lu wrote: |
|
- Today, Ronic and I locked at the amplifier current of 2 A and obtained ~60% coupling after optimizing the CEP (see Figure 1).
- The injected power is 10 W at 2 A. We measured only 14 kW inside the cavity, which corresponds to an effective gain of 1,400 and a full gain of 2,300. The cavity finesse is 23,000 and the normal gain should be around 6,200.
- We found fluctuations in transmission, possibly because of mode degradation. Tomorrow we will use D-shape mirrors to suppress high-order modes and optimize alignment and locking.
| Xinyi Lu wrote: |
|
Today, Ronic and I installed the new telescope and locked the cavity.
- We locked at the amplifier current of 1 A and obtained 32% of coupling. (see Figure 1)
- The telescope was designed for a current of 2 A (output power ~10 W). To inject this power, we need to add some filters to devices.
- For CEP tuning, when we changed the AOM frequency while cavity locking, sometimes it caused unlock and power drops. It will be dangerous in high-power cases. So it's better to optimize the AOM frequency in low power and just tune the laser current in high power. Now the current variation range of the menhir laser is 750mA to 950mA.
| Xinyi Lu wrote: |
|
- These days, Ronic, Fatematuj and I measured the beam parameters of the output of the third-stage amplifier.
- We used 2 wedges and reflection filters to reduce the intensity on the CCD.
- We measured multiple points at pump current of 2 A (output power ~10 W). The waist diameter of the output is w_x = 792.26 um, w_y=873.90 um.
- The next step is to design the telescope and improve the coupling efficiency.
|
|
|
|
|
| Attachment 1: Screenshot_2024-03-20_0_090501.png
|  |
| Attachment 2: Screenshot_2024-03-20_4_110622.png
|  |
| Attachment 3: M3_window.png
|  |
|
199
|
Wed Mar 13 19:44:41 2024 |
Xinyi Lu | Fixed | info | lasers and optics | Optical room | Injection at the amplifier current of 2 A | Today, Ronic and I optimized the locking at the amplifier current of 2 A and obtained ~ 21 kW inside the cavity.
- When all the iris open, the injected power is 10 W and the coupling is ~ 40%, corresponding to an effective gain of 2,100 and a full gain of 5,250. But the coupling may not be the true value because there is a large spot around the output beam.
- We have optimized the CEP, alignment, D-shaped mirrors and locking state. We optimized alignment after leaving the iris open and the inside power went from 14kW to 21kW.
- The transmission and reflection signals both have some same fluctuations, and they seem to come from the cavity. It's possible that the over-angled mirror mount could be the cause, but not sure. We will check in different power and see the stability of the signal.
- In addition, we found that the design values of the mirror incidence angles for the SBOX (3.359°, 5.900°) are different from the mirror ratings (1.146°). This may result in parameters such as reflection and transmission being different from the datasheet. It will also change the estimated maximum finesse, gain, and power inside the cavity. It might be better if the mirror parameters could be recalculated based on the actual angle of incidence.
| Xinyi Lu wrote: |
|
- Today, Ronic and I locked at the amplifier current of 2 A and obtained ~60% coupling after optimizing the CEP (see Figure 1).
- The injected power is 10 W at 2 A. We measured only 14 kW inside the cavity, which corresponds to an effective gain of 1,400 and a full gain of 2,300. The cavity finesse is 23,000 and the normal gain should be around 6,200.
- We found fluctuations in transmission, possibly because of mode degradation. Tomorrow we will use D-shape mirrors to suppress high-order modes and optimize alignment and locking.
| Xinyi Lu wrote: |
|
Today, Ronic and I installed the new telescope and locked the cavity.
- We locked at the amplifier current of 1 A and obtained 32% of coupling. (see Figure 1)
- The telescope was designed for a current of 2 A (output power ~10 W). To inject this power, we need to add some filters to devices.
- For CEP tuning, when we changed the AOM frequency while cavity locking, sometimes it caused unlock and power drops. It will be dangerous in high-power cases. So it's better to optimize the AOM frequency in low power and just tune the laser current in high power. Now the current variation range of the menhir laser is 750mA to 950mA.
| Xinyi Lu wrote: |
|
- These days, Ronic, Fatematuj and I measured the beam parameters of the output of the third-stage amplifier.
- We used 2 wedges and reflection filters to reduce the intensity on the CCD.
- We measured multiple points at pump current of 2 A (output power ~10 W). The waist diameter of the output is w_x = 792.26 um, w_y=873.90 um.
- The next step is to design the telescope and improve the coupling efficiency.
|
|
|
|
| Attachment 1: 21kW_power_at_2A_injection.png
|  |
|
198
|
Tue Mar 12 22:13:47 2024 |
Xinyi Lu | Fixed | info | lasers and optics | Optical room | Coupling efficiency improvement | - Today, Ronic and I locked at the amplifier current of 2 A and obtained ~60% coupling after optimizing the CEP (see Figure 1).
- The injected power is 10 W at 2 A. We measured only 14 kW inside the cavity, which corresponds to an effective gain of 1,400 and a full gain of 2,300. The cavity finesse is 23,000 and the normal gain should be around 6,200.
- We found fluctuations in transmission, possibly because of mode degradation. Tomorrow we will use D-shape mirrors to suppress high-order modes and optimize alignment and locking.
| Xinyi Lu wrote: |
|
Today, Ronic and I installed the new telescope and locked the cavity.
- We locked at the amplifier current of 1 A and obtained 32% of coupling. (see Figure 1)
- The telescope was designed for a current of 2 A (output power ~10 W). To inject this power, we need to add some filters to devices.
- For CEP tuning, when we changed the AOM frequency while cavity locking, sometimes it caused unlock and power drops. It will be dangerous in high-power cases. So it's better to optimize the AOM frequency in low power and just tune the laser current in high power. Now the current variation range of the menhir laser is 750mA to 950mA.
| Xinyi Lu wrote: |
|
- These days, Ronic, Fatematuj and I measured the beam parameters of the output of the third-stage amplifier.
- We used 2 wedges and reflection filters to reduce the intensity on the CCD.
- We measured multiple points at pump current of 2 A (output power ~10 W). The waist diameter of the output is w_x = 792.26 um, w_y=873.90 um.
- The next step is to design the telescope and improve the coupling efficiency.
|
|
|
| Attachment 1: Screenshot_2024-03-12_0_192348.png
| 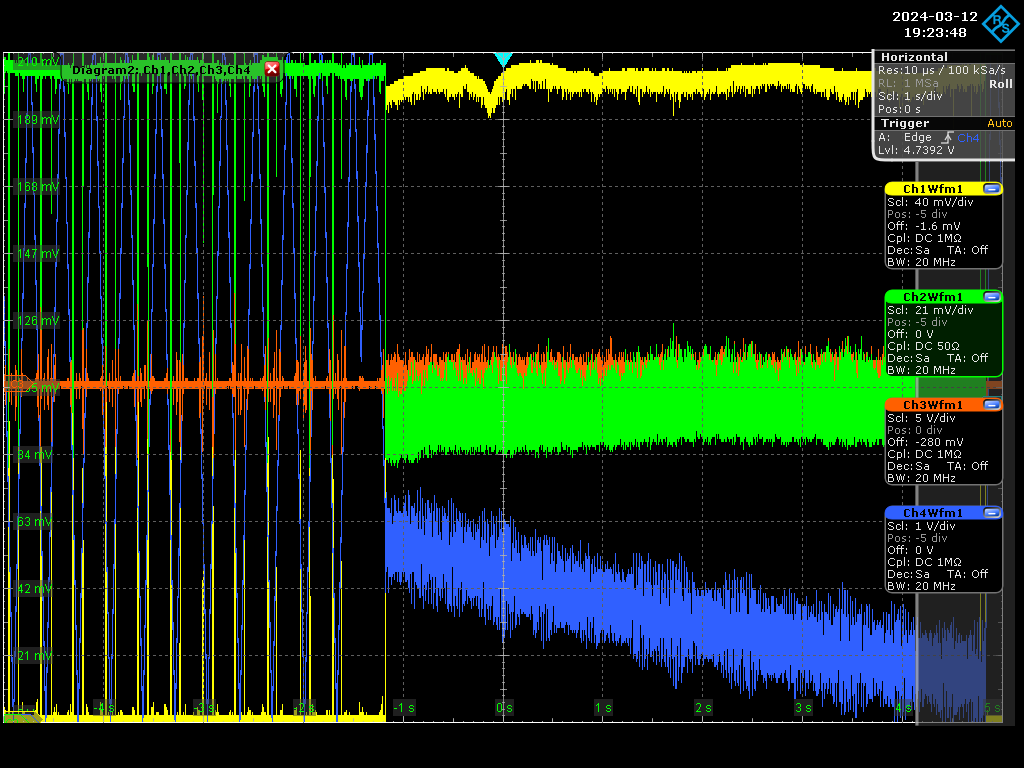 |
|
197
|
Fri Mar 8 18:04:43 2024 |
Xinyi Lu | Fixed | info | lasers and optics | Optical room | Coupling efficiency improvement | Today, Ronic and I installed the new telescope and locked the cavity.
- We locked at the amplifier current of 1 A and obtained 32% of coupling. (see Figure 1)
- The telescope was designed for a current of 2 A (output power ~10 W). To inject this power, we need to add some filters to devices.
- For CEP tuning, when we changed the AOM frequency while cavity locking, sometimes it caused unlock and power drops. It will be dangerous in high-power cases. So it's better to optimize the AOM frequency in low power and just tune the laser current in high power. Now the current variation range of the menhir laser is 750mA to 950mA.
| Xinyi Lu wrote: |
|
- These days, Ronic, Fatematuj and I measured the beam parameters of the output of the third-stage amplifier.
- We used 2 wedges and reflection filters to reduce the intensity on the CCD.
- We measured multiple points at pump current of 2 A (output power ~10 W). The waist diameter of the output is w_x = 792.26 um, w_y=873.90 um.
- The next step is to design the telescope and improve the coupling efficiency.
|
|
| Attachment 1: Screenshot_2024-03-08_0_172245.png
|  |
|
196
|
Thu Mar 7 18:55:42 2024 |
Xinyi Lu | Fixed | info | lasers and optics | Optical room | Coupling efficiency improvement | - These days, Ronic, Fatematuj and I measured the beam parameters of the output of the third-stage amplifier.
- We used 2 wedges and reflection filters to reduce the intensity on the CCD.
- We measured multiple points at pump current of 2 A (output power ~10 W). The waist diameter of the output is w_x = 792.26 um, w_y=873.90 um.
- The next step is to design the telescope and improve the coupling efficiency. |
| Attachment 1: beam_after_lens.png
| 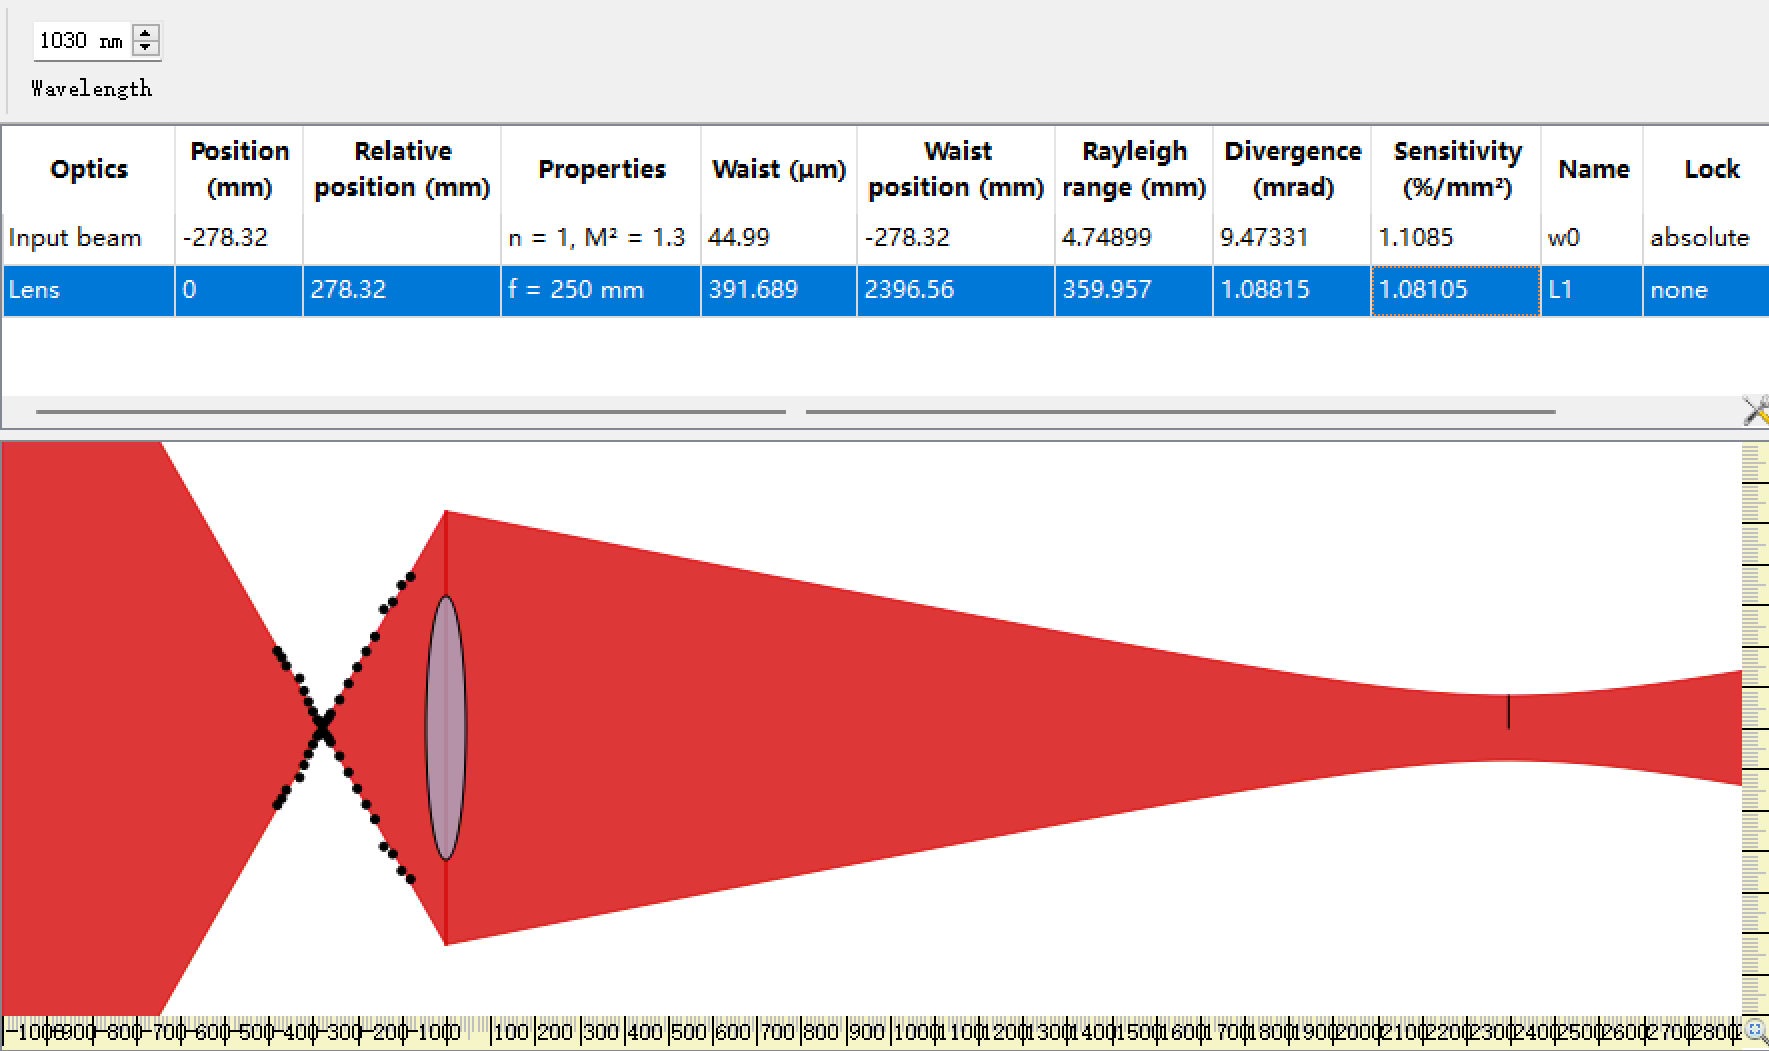 |
|
195
|
Wed Feb 28 17:26:46 2024 |
Ronic Chiche | Fixed | info | lasers and optics | software | Optical room | 100W CELIA laser amplifier "how's to" document | 1st version of the document.
if some information is not correct or missing, give any comment by replying to this post. |
| Attachment 1: How_to_start_the_Amplifier_v1.pdf
|
|
194
|
Tue Feb 27 17:51:56 2024 |
Xinyi Lu | Fixed | info | lasers and optics | Optical room | Amplified laser injection | In the last two days, Ronic and I connected the amplifier and locked the cavity.
- We installed an iris on the output to remove a part of the pump.
- We turned on the second stage of the amplifier. When locking, the injected power is 220 mW and the transmitted power after M2 is 26 uW.
- Low gain and coupling efficiency due to bad mode matching and CEP.
Next steps:
- Turn on the third stage of the amplifier, measure the beam parameters, and adjust the telescope.
- Check the adjustment range of AOM frequency that enables the amplifier to operate safely.
- Measure consecutive fundamental mode resonances to determine the direction of AOM frequency tuning. |
| Attachment 1: Screenshot_2024-02-27_1_165535.png
| 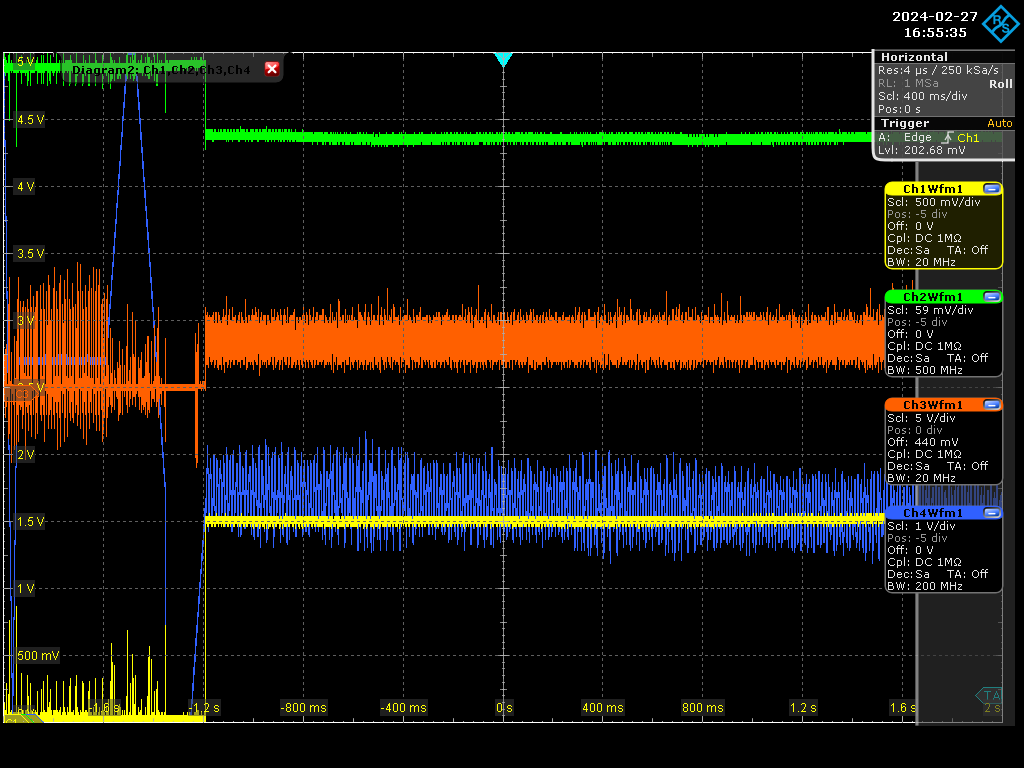 |
|
193
|
Mon Feb 26 16:53:24 2024 |
Xinyi Lu | Fixed | info | lasers and optics | Optical room | Menhir pulsed laser locking | here is the code to get this last curve
| Xinyi Lu wrote: |
|
Last week, Ronic and I focused on CEP measurements of the menhir laser.
- Measurements without Cavity Locking:
- Direct measurement of repetition rate (Frep) with a spectrum analyzer. Altering the laser pump current from 950mA to 850mA, Frep changed by +28Hz.
- Measurement of the variation of carrier-envelope frequency (Fceo) by beating with CW laser. Altering the laser pump current from 950mA to 850mA resulted in a beating frequency of n0*dFrep + dFceo = +/-2.4MHz, so dFceo ~ 50MHz.
- Measurement with Cavity Locking:
- Maintaining cavity locking, we changed the laser pump current and AOM frequency to record the transmitted power of 5 consecutive fundamental mode (TEM00) resonances.
- The pump currents were set to 850 mA, 900 mA and 950 mA, and the AOM frequency were set to 210 MHz and 250 MHz. We then plotted the measured transmission amplitude values against the theoretical gain curve (see Figure 1).
- By adjusting the CEP, we reach the top point on the curve, which is the maximum gain. At this point, the coupling frequency increases from 10% to 50% (see Figure 2).
- We observe that a 100mA change in pump current adjusts the CEP for pi/2, while changing the AOM frequency by +/-40MHz adjusts the CEP for pi. In summary, our CEP tuning range is about 3pi/2 (130 MHz) - not the full 2pi, but still probably giving us maximum gain.
- Next Steps:
- Investigate factors associated with changes in CEP, such as laser temperature or pressure.
- Discuss with Menhir the feasibility of expanding the laser pump current adjustment range (now limited to 100mA).
- Optimize AOM frequency and locking status, connect the amplifier.
| Xinyi Lu wrote: |
|
Here is a simulation of the relative FP-cavity gain vs the CEP for a Finesse of 23000 and taking into account the Menhir laser optical spectrum and several CVBG parameters.
I added the commented Matlab code to produce this plot.
| Xinyi Lu wrote: |
|
These days, Ronic, Daniele and I achieved stable cavity locking with the menhir pulsed laser.
- After vacuuming, the current cavity finesse is now about 23,000. The diameter of the cavity mode is w_x=2.2mm, w_y=2.7mm.
- We had to compensate for frequency drift by manually adjusting the cavity length to keep locking.
Now the problem is that CEP's compensation range is not enough. The laser CEP is drifting from day to day. We adjusted the CEP by tuning the pump current of the menhir laser, but the adjustment range was not enough.
- The laser pump current is varied in the locking state and the variation of repetition rate is recorded. The current range is 850mA to 950mA and the repetition rate changes by 24 Hz. The calculation process is shown in Figure 3.
- By calculation, the variation of CEP caused by the variation of laser current is only π/2, which we hope is 2π.
- For Gamma Factory, the target FSR is 40 MHz, so the 4-pulse stack provides 4 times CEP tuning range to meet the requirements. But for our experiment, it seems not enough now.
The next step is to evaluate the gap to the maximum gain and draw the curve of CEP. Then we will discuss solutions.
|
|
|
|
| Attachment 1: Gain_vs_CEP.m
|
clear
clc

c=3e8;                      % speed of light

% laser parameters
lambda0=1031.6e-9;          % central wavelength (m)
dlambda0=6.2e-9;            % spectral LW (m)
Frep0=160.3e6;              % laser repetition rate (Hz)
CEP0=0;                     % arbitrary CEP value (rad)

% CVBG parameters
CVBG=3;                      % choose the version of the CVBG
switch CVBG
    case 1
        % N40-05
        lambda1=1031.61e-9;   % central wavelength (m)
        dlambda1=2.2e-9;      % spectral LW (m)
    case 2
        % N40-01
        lambda1=1031.55e-9;   % central wavelength (m)
        dlambda1=1.92e-9;     % spectral LW (m)
    case 3
        %N40-20
        lambda1=1031.64e-9;   % central wavelength (m)
        dlambda1=2.49e-9;     % spectral LW (m)
end
lambda_min=lambda1-dlambda1/2; % minimum wavelength limit of the CVBG
lambda_max=lambda1+dlambda1/2; % maximum wavelength limit of the CVBG

% wavelength vector
lambda=linspace(lambda0-5*dlambda0,lambda0+5*dlambda0,1e5);
% laser power vs wavelentgth
Plas=Plaser(lambda,lambda0,dlambda0,0,1);
% laser power after CVBG vs wavelentgth
Pcvbg=Plaser(lambda,lambda0,dlambda0,lambda_min,lambda_max);

figure(1)
clf
plot(lambda*1e9,Plas)
hold on
plot(lambda*1e9,Pcvbg)
grid on
xlabel('wavelength (nm)')
ylabel('laser power (a.u)')
title('laser spectral power before and after CVBG')
legend('before CVBG','after CVBG')

nmin=floor(c/lambda_max/Frep0);   % minimum laser resonance index
nmax=ceil(c/lambda_min/Frep0);    % maximum laser resonance index
nmean=(nmin+nmax)/2;              % average laser resonance index
nv=nmin:nmax;                     % vector of resonance indexes
flas=(nv+CEP0/2/pi)*Frep0;        % vector of laser frequencies
lambda=c./flas;                   % new vector of wavelength for the laser
% laser power after CVBG vs wavelentgth
Pcvbg=Plaser(lambda,lambda0,dlambda0,lambda_min,lambda_max);

figure(2)
clf
plot(lambda*1e9,Pcvbg)
grid on
xlabel('wavelength (nm)')
ylabel('laser power (a.u)')
title('laser spectral power after CVBG')

% FP-cavity description
FSR=Frep0;          % Free Spectral Range of the FP-cavity
F=23000;            % Finesse of the FP-cavity
LW=FSR/F;           % FP-cavity linewidth definition

N=1e3;              % Nb of CEP simulation steps
cepv=linspace(-4*pi,5*pi,N);    % CEP vector
Gcav=zeros(1,N);                % FP-cavity gain vector initialization
for k=1:N
    dfrep=-cepv(k)/2/pi/(nmean+cepv(k)/2/pi)*FSR; % dfrep = frep - FSR
    df=(nv-nmean).*dfrep;                      % df = flas(n) - n*FSR
    T=Airy(df,LW);                            % power FP-cavity gain vs df
    Gcav(k)=sum(T.*Pcvbg)/sum(Pcvbg);         % total FP-cavity gain
end

figure(3)
clf
semilogy(cepv/pi,Gcav)
grid on
xlabel('CEP/pi (rad/rad)')
ylabel('Relative cavity gain (a.u)')
title('Relative cavity gain vs CEP')
%legend('cvbg N40-05','cvbg N40-01','cvbg N40-20')
hold on

%% measurements
% dfrep = +28Hz (frep@950mA - frep@850mA) => dCEP = -2rad

% measurements on 22/02/2024 Vinput=30mV
Idm=[0 1 2 3];
Vm=[63 164 185 64]/3100;
semilogy((Idm-1.55)*2,Vm,'*')

% measurements on 23/02/2024 Vinput=30mV
V0=2700;
NIdm=[0 1 2 3 4];
V850m=[45 90 303 66 37]/V0;
V900m=[41 126 202 61 36]/V0;
V950m=[58 164 147 55 34]/V0;
semilogy(NIdm*2-3.5,V850m,'o')
semilogy(NIdm*2-3.25,V900m,'o')
semilogy(NIdm*2-3,V950m,'o')

% measurements on 23/02/2024 Vinput=94mV
V1=650;
Vn850m=663/V1;
Vn900m=114/V1;
Vn950m=74/V1;
semilogy(0,Vn850m,'g+','linewidth',2)
semilogy(0.25,Vn900m,'+','linewidth',2)
semilogy(0.5,Vn950m,'+','linewidth',2)

legend('theoretical curve with F=23000','faom=250MHz I=950mA 22/02/2024', ...
'faom=250MHz I=850mA 23/02/2024','faom=250MHz I=900mA 23/02/2024','faom=250MHz I=950mA 23/02/2024', ...
'faom=210MHz I=850mA 23/02/2024','faom=210MHz I=900mA 23/02/2024','faom=210MHz I=950mA 23/02/2024')

% Laser power after CVBG function
function Pcvbg=Plaser(lambda,lambda0,dlambda0,lambda_min,lambda_max)
Plas=sech(1.7625*(lambda-lambda0)/dlambda0).^2;
Tcvbg=lambda>=lambda_min & lambda<=lambda_max;
Pcvbg=Plas.*Tcvbg;
end

% FP-cavity Airy function
function T=Airy(df,LW)
T=1./(1+(2*df/LW).^2);
end
|
|